

Signals: S4 Valuation & Appraisal Gap · S1 Insurance Repricing · S6 Chronic Climate Stress
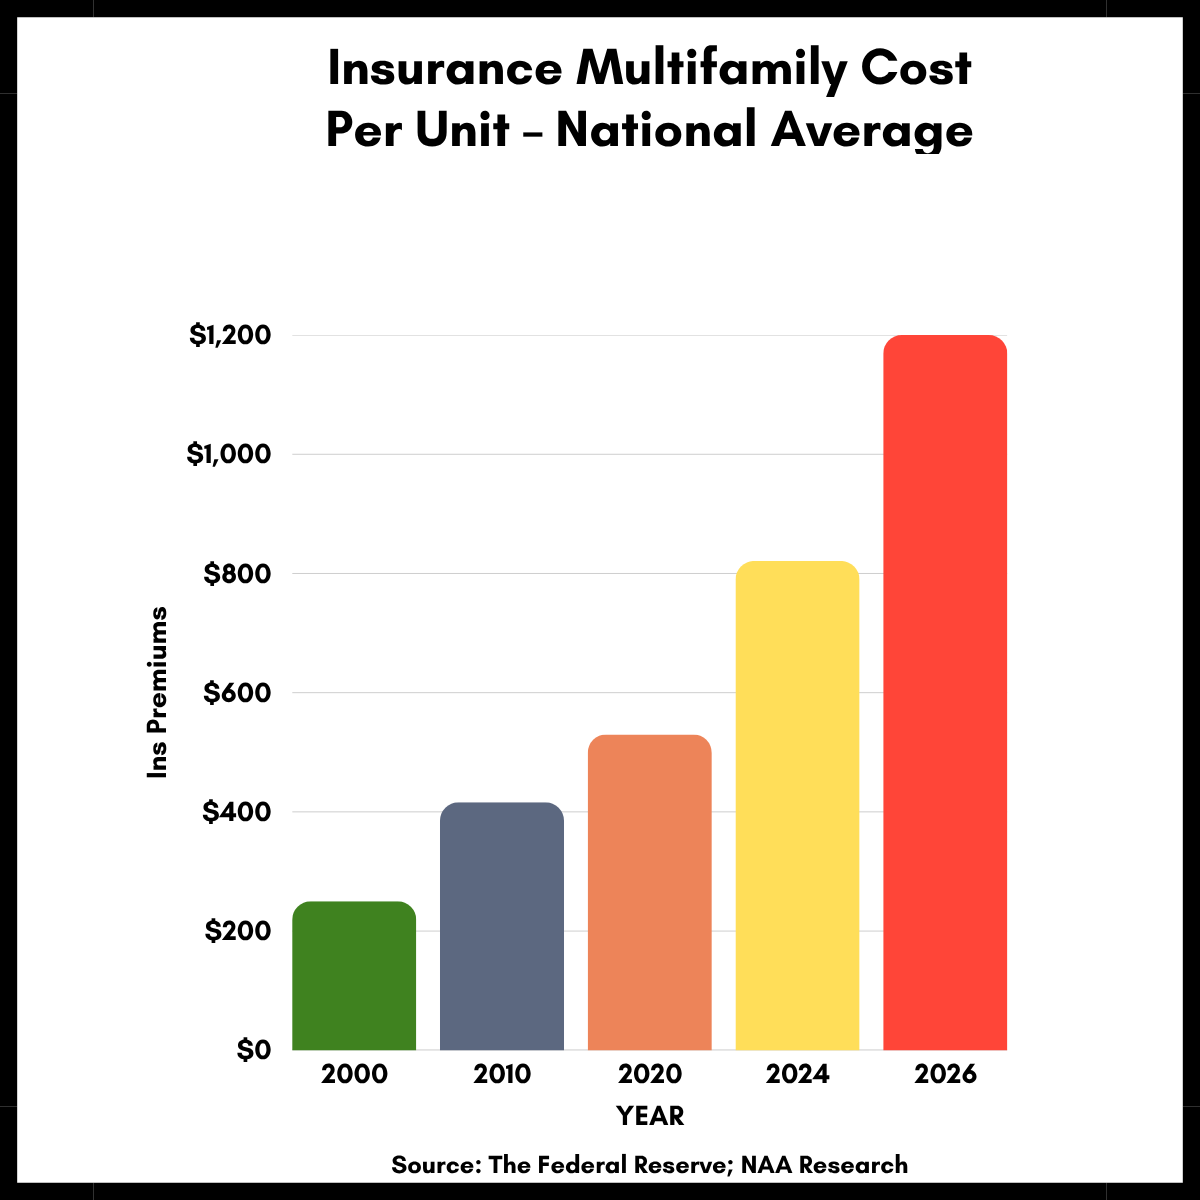
Multifamily insurance cost $285.83 per unit in 2017. By 2024, it cost $878.91. That’s a 207.5% increase in seven years.
The standard Sun Belt pro forma escalates insurance at 4% per year.
Those two facts cannot both survive a five-year hold. Here is which one breaks first, and it is not the one most sponsors stress-test.
Market Signal
The insurance line stopped behaving like an operating expense and started behaving like a structural market feature. The measured version of that is now available rather than anecdotal.
Across the four major commercial asset classes, insurance costs grew 154% between 2017 and 2024, a compound annual rate of 14.3%. By 2024, insurance consumed 4.1% of landlords’ net operating income, up from 1.9% in 2017, with the multifamily-only share at 6.6%. Multifamily carried the steepest increase of the four.
The dispersion inside that average is where the underwriting problem lives. Multifamily assets in high-risk markets pay, on average, 69% higher premiums than comparable assets in low-risk markets, and trade at roughly a 25% discount to those low-risk comps.
That discount is the part worth sitting with. It is not a forecast of how climate risk might eventually affect pricing. It measures what it has already done.
The value effect has also been quantified at the portfolio level. Since the fourth quarter of 2019, insurance cost growth alone is associated with a modeled 3.6% decline in multifamily property values nationwide. Regionally, it is far heavier. The South Central region shows 7.8% and Florida 6.8%.
At the deal level, Yardi Matrix benchmarking puts Houston multifamily at $1,115 per unit per year as of January 2024, up 40.4% year on year against a $636 per unit national average. That is the market benchmark a broker’s pro forma has to clear before any escalator is applied, and many still start below it.
A second signal operates beneath the insurance one on a slower clock, which is why this brief carries a chronic-stress tag rather than only an acute-hazard tag.
Satellite radar analysis published in Nature Cities found that 28 of the most populous US cities are sinking, at rates between 2 and 10 millimeters per year. In every city studied, at least 20% of the urban area is subsiding. Houston is the fastest-sinking major US city, with areas dropping more than 20 millimeters annually. 42% of its land area exceeds 5 millimeters each year, and 12% exceeds 10 millimeters each year.
The dominant cause is groundwater extraction. That matters commercially because it makes subsidence a policy-linked variable rather than a purely physical one. Groundwater rules can change. Land sinking because of pumping has a trajectory that is partly a regulatory question, which means it is forecastable in a way a hurricane track is not.
Subsidence does not damage a building on any schedule you will notice during a hold. What it does is quietly lower the parcel’s elevation relative to the flood plane, which reprices flood exposure, which reprices insurance, which reprices the asset.
Deal Scenario
The following is a composite model; note that every figure in this section is modeled unless it cites a source below. Method: a stress-case year-one insurance input of $1,500 per unit, set deliberately above the Yardi Matrix Houston benchmark of $1,115 per unit as of January 2024, escalated within the observed 14.3% CAGR band, with all other pro-forma inputs held at the sponsor’s original assumptions.
A 500-unit Class B multifamily asset in a Sun Belt metro. Houston, Tampa, or Phoenix all work. The pressure points differ, but the arithmetic doesn’t.
The purchase price is $75 million at a 5.5% going-in cap rate, producing year-one NOI of $4,125,000. The loan is 65% LTV, so $48.75 million at 6% on a thirty-year amortization. Annual debt service is approximately $3,507,000.
Year-one DSCR is 1.18. Tight, but considered workable if expenses hold.
The standard five-year model assumes insurance rising 4% annually, utilities increasing 3%, NOI growing 3%, and the exit cap drifting modestly from 5.5% to 5.75%.
Run it, and the deal works. Year-five NOI of about $4.64 million. Exit value near $80.7 million. Debt amortized to roughly $45.4 million. Equity proceeds of about $35.4 million on an initial equity check of $26.25 million. A levered IRR near 9%.
That deal clears the investment committee. The LP reads the memo and signs.
Now replace three assumptions with the market data above and change nothing else.
Insurance starts at $1,500 per unit, totaling $750,000 per year. This asset pays that, and it sits well above the January 2024 Yardi Matrix Houston benchmark of $1,115 per unit by design: this is a stress test built on a high-exposure Sun Belt asset, and a deliberately adverse starting premium is the point of the exercise, not an error. That $750,000 is 18% of year-one NOI before a single dollar of debt service. Escalate it at 12% rather than 4%, which sits below the 14.3% compound rate actually observed across the asset classes. Run utilities at 5%. Hold NOI flat, which is what a supply-pressured Sun Belt market with concessions and lease-up competition currently looks like.
Year one, the DSCR holds at 1.18. You are where you underwrote.
Year two, it slips to 1.15. Insurance has reached $840,000. Combined operating drag against the base model is $75,000.
Year three, it falls to 1.13. Insurance hits $941,000. The drag is $161,000. You are now below the 1.15 covenant threshold carried on many agency and bank loans.
Notice what happened. The IRR is not what failed. The covenant is.
Underwriting Analysis
The DSCR breaks in year three. The IRR doesn’t turn negative until later, and by then someone else has already decided the outcome.
That sequencing is the single most useful aspect of this model because it reverses the order in which most sponsors run their sensitivities. The convention is to stress the exit cap, then the rent growth, then perhaps the insurance line. But a covenant breach is not a slower version of a bad return. It is a different event with a different owner.
Once you trip the covenant, the lender controls the outcome. Cash may be swept. Distributions stop. A waiver becomes a negotiation in which the borrower has no leverage, because the alternative is a technical default on an asset the lender already knows is repricing. The sponsor who planned to sell in year five now discovers that year three decided it.
So the analysis has to run in a different order.
Start with the covenant, not the return. Identify the DSCR floor in the loan documents, then solve for the insurance escalator that breaches it. That number, not the IRR, is your real underwriting constraint.
Price insurance to the market, not to the file. Get a current quote for the specific asset. A broker’s pro forma carrying a below-benchmark number in a market benchmarking at $1,115 per unit as of January 2024 is understating the base before compounding begins.
Test the escalator across its plausible range, not at a point. The observed compound rate across asset classes is 14.3%. Modeling 4% is not conservative. It is a different market from a different time.
Ask what the NOI assumption is doing. The base model above only survives because NOI grows at 3%. In a supply-pressured submarket with concessions, flat is the defensible input, and flat is what converts a thin DSCR into a breached one.
The most sensitive input is the insurance escalator, followed by the NOI growth assumption. The exit cap, which usually drives the sensitivity table, matters the least. It only affects the terminal value. The escalator affects every year of the hold and then feeds the terminal value through NOI, so it hits twice.
One more branch the model does not capture is worth naming because it does not show up as a number at all. The scenario above assumes coverage stays available at some price. If the carrier declines to renew, the asset moves to surplus lines or a state plan at a materially different price for materially narrower coverage. Most loan documents require coverage at specified limits, thereby turning a placement failure into a technical default, independent of any DSCR calculation. That is a second, faster path to the same lender conversation, and no escalator assumption will predict it.
This is what underwriting with climate in the denominator means in practice. Every ratio that determines whether a deal works has the same architecture: Cap rate, DSCR, yield on cost, debt yield. Sponsors focus on the numerator, telling a story about revenue, while the denominator slips beneath them.
Strategic Implications
The portfolio consequence is that insurance trajectory now differentiates Sun Belt submarkets more sharply than rent growth does.
Two assets with identical rent rolls, identical basis, and identical vintage can produce materially different five-year outcomes based on flood zone, construction type, roof age, and deductible structure. That spread used to be operational noise. At a 14.3% compound rate, it is the deal.
It also changes what diligence is for.
The declarations page and three cycles of renewal correspondence tell you more about the year-five exit than the rent roll does, and both are cheap to request. A seller whose carrier has signaled non-renewal is selling a repricing that the offering memorandum does not mention.
The subsidence layer adds a longer-dated version of the same discipline. If you are buying in Houston, or in any of the twenty-eight metros in that study, the parcel’s elevation trajectory is a knowable input rather than a surprise. It will not affect your hold. It will affect the buyer who is underwriting a hold that starts where yours ends, and that buyer sets your exit price.
Brief 2 ran this arithmetic on a single Houston acquisition and showed where the climate costs hide in a broker’s pro forma. Brief 8 applies the same logic to a stabilized institutional asset and asks a harder question which is what happens when the building itself, rather than the insurance line, stops working?
As always, KNOW YOUR SIGNALS and BE CLIMATE READY!
Jamie
Run this on your own deal
The CRDF Deal Stress Test™ built for this brief takes your pro forma, applies a realistic insurance escalator, and solves for the year your DSCR covenant breaks rather than the year your IRR disappoints. Free, no signup: Brief 5 · CRDF Deal Stress Test™ (xlsx)
New to the framework? The blank master Signal Tracker and Deal Stress Test workbooks are at climatereadyre.com/tools.
Related briefs
Same signal (S4 Valuation & Appraisal Gap):
Brief 2 · Houston Multifamily Insurance: $1,115 per Unit, Up 40.4%
Brief 4 · How Much Does Coastal Hotel Insurance Cost? Florida Trends & Benchmarks
Brief 1 · Insurance Premium Hikes: Impact on Cap Rates & Property Value
Next in sequence:
Brief 6 · The 30-Year Mortgage and Climate Risk: What the LA Fires Exposed About Loan Duration - coming soon
Sources
Every figure above, with the date the data covers, the date it was published, and the date I verified it.
Multifamily insurance cost per unit — $285.83 per unit in 2017 rising to $878.91 per unit in 2024, an increase of 207.5%.
Bisnow — First Street Foundation NCREIF-based commercial study on climate risk and US commercial property values · Scope: built on 25 years of National Council of Real Estate Investment Fiduciaries (NCREIF) performance data across 120 US metro areas · Data as of 25 years of NCREIF performance data across 120 US metro areas, cost series 2017–2024 · Published May 5, 2026 · Accessed Aug 2026
First Street’s primary report page sits behind a terms-acceptance gate and could not be opened, so this and the three entries below rest on Bisnow’s reporting as a credible secondary source rather than on the primary document.
Insurance cost growth across the four major CRE asset classes — 154% growth 2017–2024, a 14.3% CAGR; insurance consumed 4.1% of net operating income in 2024, up from 1.9% in 2017, with 6.6% labeled multifamily.
Bisnow — First Street Foundation NCREIF-based commercial study on climate risk and US commercial property values · Scope: built on 25 years of National Council of Real Estate Investment Fiduciaries (NCREIF) performance data across 120 US metro areas · Data as of 25 years of NCREIF performance data across 120 US metro areas, cost series 2017–2024 · Published May 5, 2026 · Accessed Aug 2026
High-risk multifamily premium and pricing gap — 69% higher premiums than comparable low-risk-market assets; roughly a 25% discount to low-risk comps.
Bisnow — First Street Foundation NCREIF-based commercial study on climate risk and US commercial property values · Scope: built on 25 years of National Council of Real Estate Investment Fiduciaries (NCREIF) performance data across 120 US metro areas · Data as of 25 years of NCREIF performance data across 120 US metro areas, cost series 2017–2024 · Published May 5, 2026 · Accessed Aug 2026
Corrected Sep 4, 2026. These two figures were previously cited to First Street’s “Property Prices in Peril”, which is a single-family residential report and contains neither figure. Both come from First Street’s NCREIF-based commercial study as reported by Bisnow.
Value effect of insurance cost growth — a modeled 3.6% decline in multifamily property values nationwide since Q4 2019; South Central 7.8%, Florida 6.8%. Multifamily only; CBRE Research using CBRE Econometric Advisors modeling on RealPage data.
CBRE — Insurance Costs Suppress Multifamily Values Most in Certain Sun Belt Markets · Data as of Q4 2019 – Q2 2024 · Published Jul 18, 2024 · Accessed Sep 2026
Houston multifamily insurance benchmark (market benchmark) — $1,115 per unit as of January 2024, up 40.4% year-on-year, against a $636 per unit national average.
Yardi Matrix — Matrix Research Bulletin: Multifamily Expenses, March 2024 · Data as of Jan 2024 · Published Mar 2024 · Accessed Sep 2026
Corrected Sep 4, 2026. This line previously cited NAA’s Premium Pulse benchmarking. That page (naahq.org/news/premium-pulse-national-multifamily-insurance-cost-acceleration) returns HTTP 403 on every attempt, and no third party quotes its figures, so it is not verifiable at source. The Yardi Matrix figure is substituted; the source is the March 2024 Matrix Research Bulletin, retrievable at the NCSHA mirror cited in Brief 2. This $1,115 figure is the market benchmark only. It is not the deal input used in the Deal Scenario, which is a separate, deliberately higher stress-case number.
Urban subsidence across major US cities — 28 cities sinking at 2–10 mm per year; at least 20% of the urban area subsiding in every city studied.
Virginia Tech News — sinking cities study, published in Nature Cities · Data as of 2015–2021 satellite radar · Published May 2025 · Accessed Aug 2026
Houston subsidence specifically — fastest-sinking major US city; areas above 20 mm per year; 42% of land area above 5 mm per year and 12% above 10 mm per year (the two shares are in the EurekAlert release of May 8, 2025 and the paper, not in the Virginia Tech article); primary cause: groundwater extraction.
Virginia Tech News — sinking cities study, published in Nature Cities · Data as of 2015–2021 satellite radar · Published May 2025 · Accessed Aug 2026
500-unit Sun Belt deal (modeled deal input) — $75M at a 5.5% cap, $4,125,000 year-one NOI, 65% LTV at 6%, $3,507,000 debt service, 1.18 DSCR, ~9% base IRR; stressed at a modeled $1,500 per unit year-one insurance input escalating 12%, utilities 5%, NOI flat, DSCR 1.13 by year 3.
CRREI modeled composite — no external source · The $1,500 per unit is a modeled stress-case input for a high-exposure Class B asset, not a market average and not a benchmark; the market benchmark is Yardi Matrix’s $1,115 per unit as of January 2024, and $1,500 sits above it by design · Method: stress-case year-one premium set above that benchmark, escalated within the observed 14.3% CAGR band, utilities $750,000 in year one in both cases, all other inputs held at the sponsor’s originals · Data as of the sources cited above · Published date not stated · Modeled — not a specific transaction
Commentary and analysis only. Not investment, financial, legal, tax, or professional advice. CRDF tools are illustrative; examples are composites drawn from public data. Do your own due diligence and consult qualified professionals.
I run this analysis on specific deals. If you are underwriting a Sun Belt asset and want the insurance escalator and covenant headroom pressure-tested before you sign, book 20 minutes.
Jamie Wolf, MBA — Founder & Publisher, Climate-Ready Real Estate Investing, © 2026, CR REI Holdings LLC