

Signals: S4 Valuation & Appraisal Gap · S1 Insurance Repricing · S5 Acute Climate Hazard
U.S. home insurance rate filings were approved at an average of ~6.3% in 2025, according to S&P Global Market Intelligence. In Minnesota, average quoted premiums rose 34%. In Florida, quoted averages run from $5,838 (Bankrate) to $8,292 (Insurify), roughly 2.4 to 2.8 times the national average. Recognizing climate risk as a measurable factor can help investors feel more informed and confident in their decisions.
Those are not disaster statistics. They are pricing decisions, made by the institutions whose entire business is calculating what risk costs. And a premium increase does not stay inside the insurance line. It moves through NOI, and NOI is what value is built on.
Here is what that transmission looks like when you run it all the way to the exit.
Market Signal
In 2023, the US homeowners insurance segment posted a $15.2 billion underwriting loss. AM Best called it the worst result of the century. The next-worst was $14.8 billion in 2011. We could well be on track to best (or “worst”) those numbers in 2026.
What followed in 2023 was not a pricing cycle. It was a repositioning. State Farm stopped writing new homeowner policies in California. Allstate had already paused new policies there in late 2022. Farmers pulled back in Florida. These are not marginal carriers. Between them, they underwrite a meaningful share of the US housing stock.
The repricing showed up immediately. Insurify’s 2026 report puts the 2025 national increase at 12%, bringing the average quoted annual premium to $2,948, with a further 4% projected for 2026, pushing the national average past $3,000 for the first time.
The state-level numbers are where the climate signal is legible. In 2025, average premiums rose 34% in Minnesota, 33% in Colorado, 28% in Iowa, 25% in Nebraska, and 24% in Oklahoma. None of those are coastal states. The driver is severe convective storms - hail, tornadoes, and straight-line wind events that have produced more than $42 billion in insured losses in each of the past three years, reaching more than $52 billion in 2025.
That matters more than a coastal headline would. It means repricing isn’t confined to the places every investor already avoids. It has reached the interior markets that most portfolios treat as the safe allocation. Implementing resilience measures can help maintain property values amid these changes.
Price is only half of it, and it is the half that gets reported. The other half is availability, and it is moving faster.
The NAIC published the first national analysis of its kind on July 31, 2026, covering 715 carriers and seven years of state-regulator filings from 2018 through 2024, against roughly 103 million active homeowners policies. Company-initiated non-renewals rose between 96% and 216% across all four NAIC zones. In the West, non-renewals per thousand in-force policies more than tripled.
These are carrier decisions, not lapses. The policyholder paid on time and did nothing wrong. Their coverage ended anyway.
Inflation-adjusted premiums over the same seven years rose 18.3% in the Northeast, 24.7% in the Midwest, 26.5% in the Southeast and 43.3% in the West. Treasury’s Federal Insurance Office found that the highest-risk ZIP codes faced non-renewal rates roughly 80% higher than those in the lowest-risk ZIP codes, with average premiums of $2,321 per year, 82% higher than in low-risk areas.
A price problem is a line item. You model a steeper escalator, accept a thinner margin, and move on.
An availability problem is binary, and it sits upstream of the entire capital stack. Most pro formas still answer the price question, but declining availability demands immediate attention to protect investment viability.
The commercial side is moving in the same direction with less press coverage.
MSCI found that insurance reached 2.4% of income receivable across its US Quarterly Property Index in the twelve months to Q3 2024, double its share five years earlier. JLL puts the rise in US commercial premiums at 88% over five years.
Insurance markets exist to do one thing. They price risk. When the institutions built to calculate the cost of risk reprice an exposure this quickly, the exposure is no longer a debate. It has become arithmetic. And when the arithmetic changes, underwriting changes with it.
Case Study
The following is a modeled composite, not a specific transaction. The method and inputs are stated below so you can check the math.
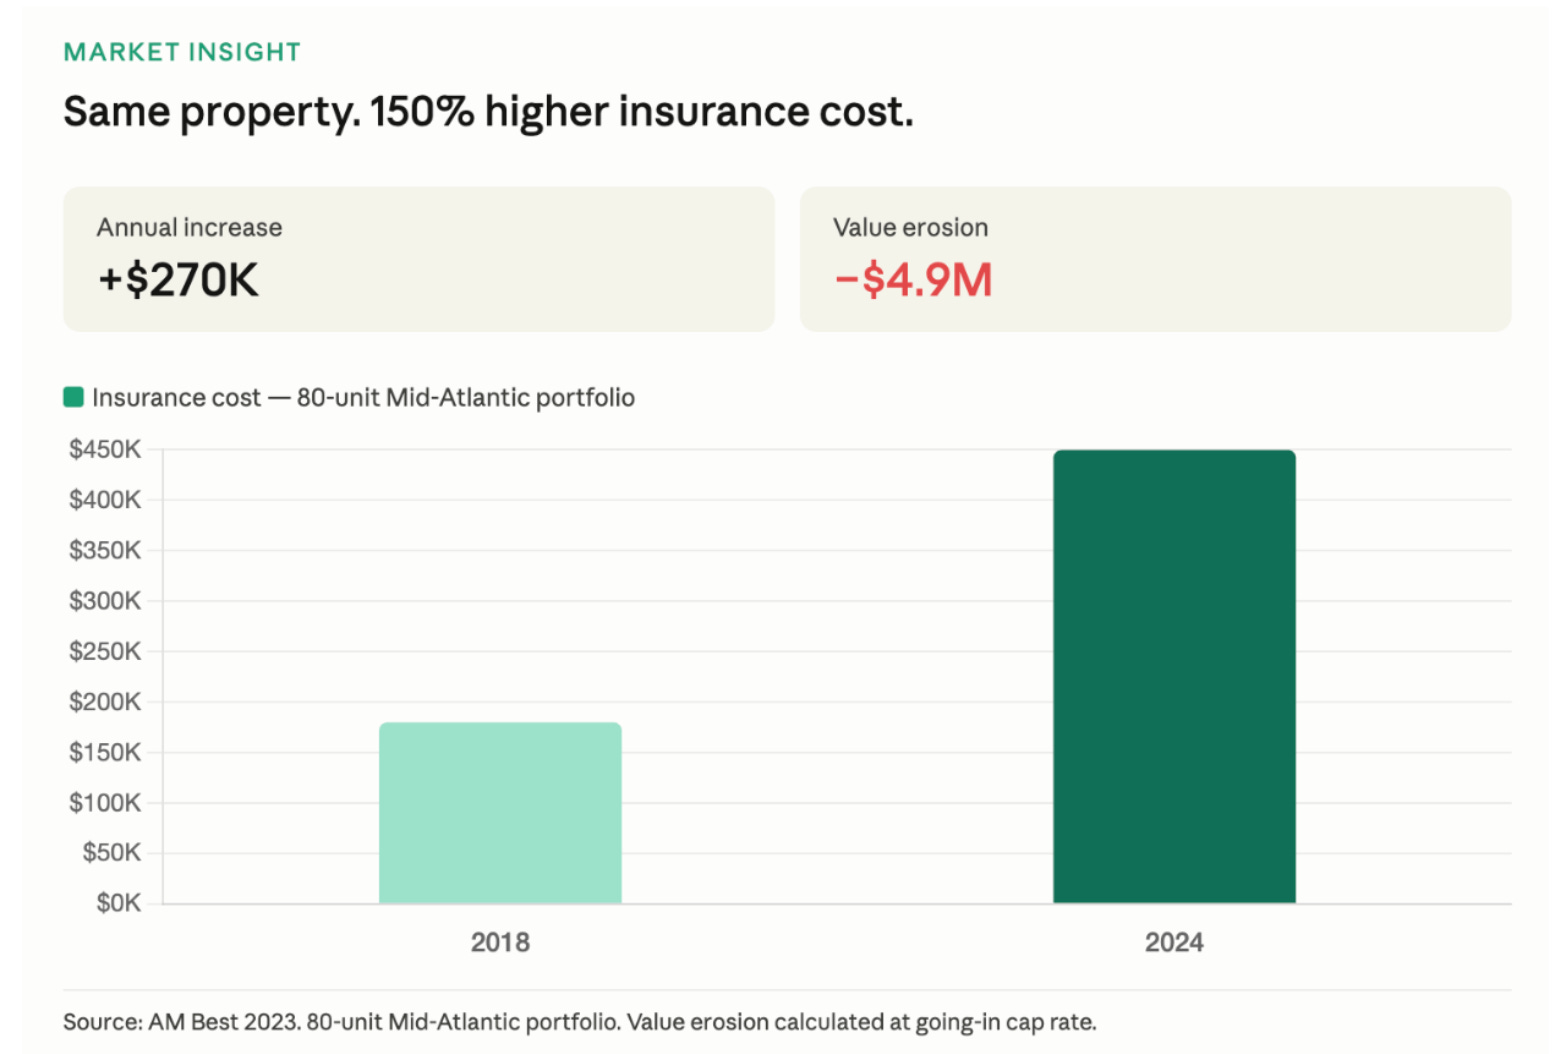
Take an 80-unit coastal multifamily asset in the Mid-Atlantic, acquired in 2020 for $15 million. At acquisition, the insurance ran $180,000 per year. That was about 1.2% of the purchase price, which nobody flagged as unusual.
Six years later, the same building costs $450,000 to insure. Two and a half times the original premium.
Nothing about the asset changed. No new units. No structural deficiency. No claims. The building is identical. The underwriting is not.
Now run the numbers the way an owner actually feels it. Across 80 units, a $270,000 annual premium increase is roughly $280 per unit per month of NOI that simply evaporates. That happens before you raise a rent, renew a lease, or refinance anything.
Then run it to value. If the asset was underwritten at a 5.5% cap rate, $270,000 in lost NOI represents about $4.9 million in value erosion on a $15 million deal (assuming no rent recovery, so the figure is an upper bound).
That is not a rounding error. Depending on how the deal was levered, that figure may represent a large share of the equity, and in some structures more than the equity.
The uncomfortable part is that none of this required a loss event. No storm hit the building. The repricing arrived on a renewal notice.
This model also misses a branch: the one that ends deals.
The scenario above assumes coverage remains available at some price. Given what the NAIC data shows about non-renewal rates, that assumption deserves its own stress test. An asset that moves to surplus lines or a state FAIR Plan is not paying a higher premium for the same product. It is paying more for materially narrower coverage, often excluding liability, theft, and water damage.
This reduction in coverage can hinder refinancing, sale, or valuation, as most loan documents require coverage at specified limits, making a coverage failure a potential default risk.
Strategic Implications
The first-order effect is NOI compression. Second-order effects decide outcomes.
Cap rates widen on exit. The next buyer is pricing the same insurance trajectory you just lived through, using better information than you had at the time of acquisition.
Liquidity contracts. If the buyer cannot secure affordable coverage, they cannot secure debt. No insurance, no loan. No loan, no buyer. Durable returns require durable insurability, and that sequence runs in only one direction.
The financing channel is concentrated. Fannie Mae alone owns or guarantees roughly one in four US single-family mortgages. When the agencies build climate exposure into their models, the change does not stay at the agencies. It propagates through every lender that sells to them.
For developers, the codes and insurance requirements being drafted now govern the assets breaking ground today. Designing to yesterday’s hazard map is the most reliable way to build tomorrow’s stranded asset.
For manufacturers and suppliers, the advantage sits with whoever can document insurer-recognized resilience performance. That is a pricing argument made to an underwriter, not an environmental argument made to a buyer.
For lending and proptech platforms, climate-adjusted data is following the path credit scoring took in the 1990s. It moves from optional overlay to embedded infrastructure, and the firms building that layer now will own the pricing rails later.
For municipal leaders, stormwater capacity and hardened utility infrastructure function as an insurance subsidy that flows directly into local property values. Communities that fund it early differentiate themselves from communities that do not.
Underneath all five, climate-adjusted underwriting is protecting the same four things. Cash flow durability. Refinancing optionality. Exit liquidity. And portfolio defensibility.
Future Signal
Watch the demographic layer, because it is the slowest signal and the hardest to reverse.
First Street’s peer-reviewed work in Nature Communications identified what it calls climate abandonment areas. These are census blocks that lost population between 2000 and 2020 in a way directly attributable to flood risk. More than 818,000 of them exist, and their cumulative net population loss over those two decades is more than 3.2 million people. Roughly 113 million Americans live in areas where flood risk is already shaping housing choice. First Street projects a further 16% decline, about 2.5 million people, from the current abandonment areas over the next thirty years.
Population durability is what makes a rent roll durable. It is upstream of everything a pro forma assumes about lease-up, renewal, and exit demand.
On the cost side, Deloitte projects the average monthly cost to insure a commercial building rising from $2,726 in 2023 to $4,890 by 2030. That is a rise of about 80% within a single typical hold period.
I expect that within roughly 24 to 36 months, a climate risk line item becomes standard in institutional deal models, sitting alongside property tax and insurance rather than in an appendix. It will likely carry four components. A ten- to twenty-year insurance projection instead of a year-one quote. A carrier withdrawal probability. A reserve earmarked for resilience capex over the hold. And an assessment of infrastructure resilience in the surrounding community, because assets do not perform in isolation.
The next cycle looks like capital chasing durability. That is a returns statement, not a moral one. A property you can still insure in year ten is a property you can still finance in year ten, and a property you can still finance is a property you can still sell.
Brief 2 takes this from the market level down to a single transaction. It walks through a Houston multifamily deal line by line and shows where climate costs hide in a broker’s pro forma.
As always, KNOW YOUR SIGNALS and BE CLIMATE READY!
Jamie
Run this on your own deal.
The CRDF Signal Tracker™ built for this brief lets you log insurance repricing signals in your market, translate them into a financial impact, and score which ones actually move your pricing. Free, no signup: Brief 1 · CRDF Signal Tracker™ (xlsx)
New to the framework? The blank master Signal Tracker and Deal Stress Test workbooks are at climatereadyre.com/tools.
Related briefs
Same signal (S1 Insurance Repricing):
Brief 0 · Why Colorado Homeowners Insurance Rates Spiked by 51.7%: What to Expect About Costs - link to come
Brief 4 · How Much Does Coastal Hotel Insurance Cost? Florida Trends & Benchmarks - link to come
Brief 11 · Hurricane Helene Aftermath: Western North Carolina Home Insurance Rates Rise 4.4% - link to come
Next in sequence:
Brief 2 · Houston Multifamily Insurance: $1,115 per Unit, Up 40.4% - link to come
Sources
Every figure above, with the date the data covers, the date it was published, and the date I verified it.
US approved homeowners rate increases, 2025 — rate filings approved at an average of about 6.3% in 2025, after about 13.6% in 2024, and about 1.8% through July 2026, per S&P Global Market Intelligence
Insurance Journal — Homeowners Insurance Market Reaches Fragmented Phase, Says S&P GMI · Data as of 2025 – Jul 2026 · Published Aug 13, 2026 · Accessed Sep 2026
Carrier withdrawals named in the body: State Farm General ceased accepting new California applications effective May 27, 2023 (State Farm newsroom, May 26, 2023); Allstate paused new California home policies in late 2022; Farmers ended Florida home, auto, and umbrella lines in July 2023 (CNN, Jul 12, 2023).
Florida average premium, second estimate — $5,838 per year, 2.4 times a $2,424 national average, per a Bankrate analysis
Moneywise — Florida home insurance costs, premiums and savings · Data as of 2026 · Published May 17, 2026 · Accessed Sep 2026
Secondary aggregator relaying a Bankrate analysis. Insurify’s $8,292 is the figure the body leads with; the two are carried as a range.
US homeowners underwriting loss, worst of the century — $15.2 billion (next worst $14.8 billion, 2011)
AM Best — Best’s Market Segment Report, US Homeowners Insurance · Data as of FY2023 · Published Jul 25, 2024 · Accessed Aug 2026
US average home insurance premium and 2025 increase — $2,948 per year, up 12% in 2025; ~4% further projected for 2026
Insurify — Insuring the American Homeowner 2026 / price projections · Data as of 2025 · Published Mar 2026 · Accessed Aug 2026
State-level 2025 premium increases — Minnesota 34%, Colorado 33%, Iowa 28%, Nebraska 25%, Oklahoma 24%
Insurify, reported via Iowa Capital Dispatch · Data as of 2025 · Published Mar 18, 2026 · Accessed Aug 2026
Florida average premium — $8,292 per year, up 18% in 2025, roughly 2.8x the US average
Insurify — Florida home insurance report · Data as of 2025 · Published 2026 · Accessed Aug 2026
Severe convective storm insured losses — more than $42 billion for three consecutive years (Munich Re); more than $52 billion in 2025 (Insurify report)
Insurify / Insurance Journal — US home insurance prices set to keep rising · Data as of 2023–2025 · Published Mar 18, 2026 · Accessed Aug 2026
Company-initiated non-renewals — up 96%–216% across all four NAIC zones; more than tripled per 1,000 policies in the West. Based on 715 carriers, 2018–2024, ~103M active policies
NAIC — Examining Homeowner Property Insurance Market Dynamics (PDF) · Data as of 2018–2024 · Published Jul 31, 2026 · Accessed Aug 2026
Inflation-adjusted premium change by zone, 2018–2024 — Northeast +18.3%, Midwest +24.7%, Southeast +26.5%, West +43.3%
NAIC — Examining Homeowner Property Insurance Market Dynamics (PDF) · Data as of 2018–2024 · Published Jul 31, 2026 · Accessed Aug 2026
Non-renewal and premium gap by risk tier — highest-risk ZIP codes ~80% higher non-renewal rate; average premium $2,321, 82% above low-risk areas
US Treasury, Federal Insurance Office — Analyses of US Homeowners Insurance Markets 2018–2022 · Data as of 2018–2022 · Published Jan 2025 · Accessed Aug 2026
FAIR Plan coverage scope — narrower coverage: NAIC says loss-of-use and personal liability are not offered, and trade reporting adds theft and water damage; residual-market plans in 33 states plus DC as of Oct 2024
NAIC — Fair Access to Insurance Requirements (FAIR) Plans · Data as of Oct 2024 · Published Dec 13, 2024 · Accessed Sep 2026
Commercial insurance as a share of property income — 2.4% of income receivable, double its share five years earlier
MSCI — Insurance Has a Bigger Bite of Commercial-Property Income · Data as of 12 months to Q3 2024 · Published Dec 9, 2024 · Accessed Aug 2026
US commercial real estate premium growth — 88% over five years
JLL — How climate risks are impacting real estate insurance costs · Data period not specified by JLL · Published Jan 23, 2025 · Accessed Aug 2026
GSE share of the single-family mortgage market — Fannie Mae alone owns or guarantees roughly 1 in 4 US single-family loans
Fannie Mae Form 10-Q, Q1 2024 (SEC EDGAR) · Data as of Mar 31, 2024 · Published 2024 · Accessed Aug 2026
Climate abandonment areas — 818,000+ census blocks; net loss of 3.2M+ people 2000–2020; 113M living where flood risk shapes housing choice; further 16% (~2.5M) projected over 30 years
First Street Foundation, published in Nature Communications · Data as of 2000–2020 · Published Dec 2023 · Accessed Aug 2026
Projected cost to insure a commercial building — $2,726/month (2023) rising to $4,890/month (2030)
Deloitte Insights — The impact of climate change on commercial real estate insurance costs · Data as of 2023, projected to 2030 · Published May 29, 2024 · Accessed Aug 2026
Forecast, not observed.
80-unit Mid-Atlantic coastal multifamily case — $15M basis, insurance $180K (2020) to $450K (2026), $270K NOI loss, ~$280/unit/month, ~$4.9M value erosion at a 5.5% cap
CRREI modeled composite, built from deal-level casework. The $180,000 base is $2,250 per unit per year, a modeled coastal Mid-Atlantic assumption; it is not benchmarked to a named source and sits well above published national multifamily per-unit averages. Method: premium delta capitalized at the acquisition cap rate · Modeled — not a market observation and not a specific transaction
Commentary and analysis only. Not investment, financial, legal, tax, or professional advice. CRDF tools are illustrative; examples are composites drawn from public data. Do your own due diligence and consult qualified professionals.
I run this analysis on specific deals. If you are underwriting an asset in a wildfire, flood, hail, or water-stressed market and want the insurance and exit assumptions pressure-tested before you sign, book 20 minutes.
Jamie Wolf, MBA — Founder & Publisher, Climate-Ready Real Estate Investing, © 2026 CR REI Holdings LLC