

Signals: S1 Insurance Repricing · S2 Credit & Mortgage Markets · S4 Valuation & Appraisal Gap
A broker hands you a 184-unit Houston deal at $28.4 million. The pro forma shows a 14.3% levered IRR over a seven-year hold. The assumptions look conservative. The comps support the basis.
Correct three line items for what Houston insurance and capex actually cost, and the same deal returns about 10% even when nothing about the building changes. Only the inputs do.
Here is where those 430 basis points hide.
Market Signal
Houston is not a speculative climate market. It is a repriced one, and the repricing is documented.
Yardi Matrix puts Houston multifamily insurance at $1,115 per unit per year as of January 2024. Nationally, Yardi Matrix tracked property insurance rising 27.7% year over year as of early 2024, with insurance expenses up 129% since 2018 to an average of $636 per unit. Houston sits at roughly 1.75x the national average, $1,115 against $636 per unit, both as of January 2024, and it got there in the same window.
The Upper Midwest shows this is not only a coastal story, and it is worth citing because the geography is unexpected. The Federal Reserve Bank of Minneapolis surveyed 35 multifamily owners operating nearly 45,000 units across Minnesota, Montana, North Dakota, and South Dakota. Their annual premiums rose an average of 14% from 2021 to 2022, 22% from 2022 to 2023, and 45% from 2023 to 2024. Roughly a third of respondents now carry more wind and hail exclusions than they did three years earlier.
Coverage is narrowing while prices are rising. An owner can hold premium flat by accepting exclusions, which shifts risk from the carrier’s balance sheet onto theirs without appearing anywhere in the operating statement.
The physical basis for Houston’s repricing is equally documented. After Hurricane Harvey, NOAA published Atlas 14 Volume 11 in 2018 and revised the rainfall depths that define a design storm in Texas. Around Houston, the 100-year 24-hour rainfall estimate moved from roughly 13 inches to about 18 inches, an increase of about 38%. Storms the drainage system was built to handle once a century now occur considerably more frequently.
Then there is the grid. Hurricane Beryl made landfall in July 2024 and cut power to about 2.26 million CenterPoint customers, out of a base of more than 2.8 million. Eight days later, about 226,000 were still dark. For a multifamily operator, an extended outage is not an inconvenience. It is concession pressure, turnover, and in a Gulf summer, a habitability question.
Deal Scenario
The following is a modeled composite built from Houston submarket conditions, not a specific transaction. Every figure in this section is modeled unless a source is provided below.
The asset is a 184-unit Class B property in a Houston submarket. The purchase price is $28.4 million, about $154,000 per unit, a modest discount to submarket comps. The seller is marketing it as a value-add.
The broker’s pro forma shows an in-place cap rate of 5.8%, year-one NOI of $1.65 million growing to $1.92 million by year three and 4% per year after that, and an exit at a 6.25% cap in year seven struck on year-eight NOI. The stack is 60% loan-to-value, $17,040,000 of interest-only debt at 6.25%, annual debt service of $1,065,000, and a year-one coverage ratio of 1.55x. On paper, it produces a 14.3% levered IRR. Every return in this brief is levered, and it is reported that way throughout.
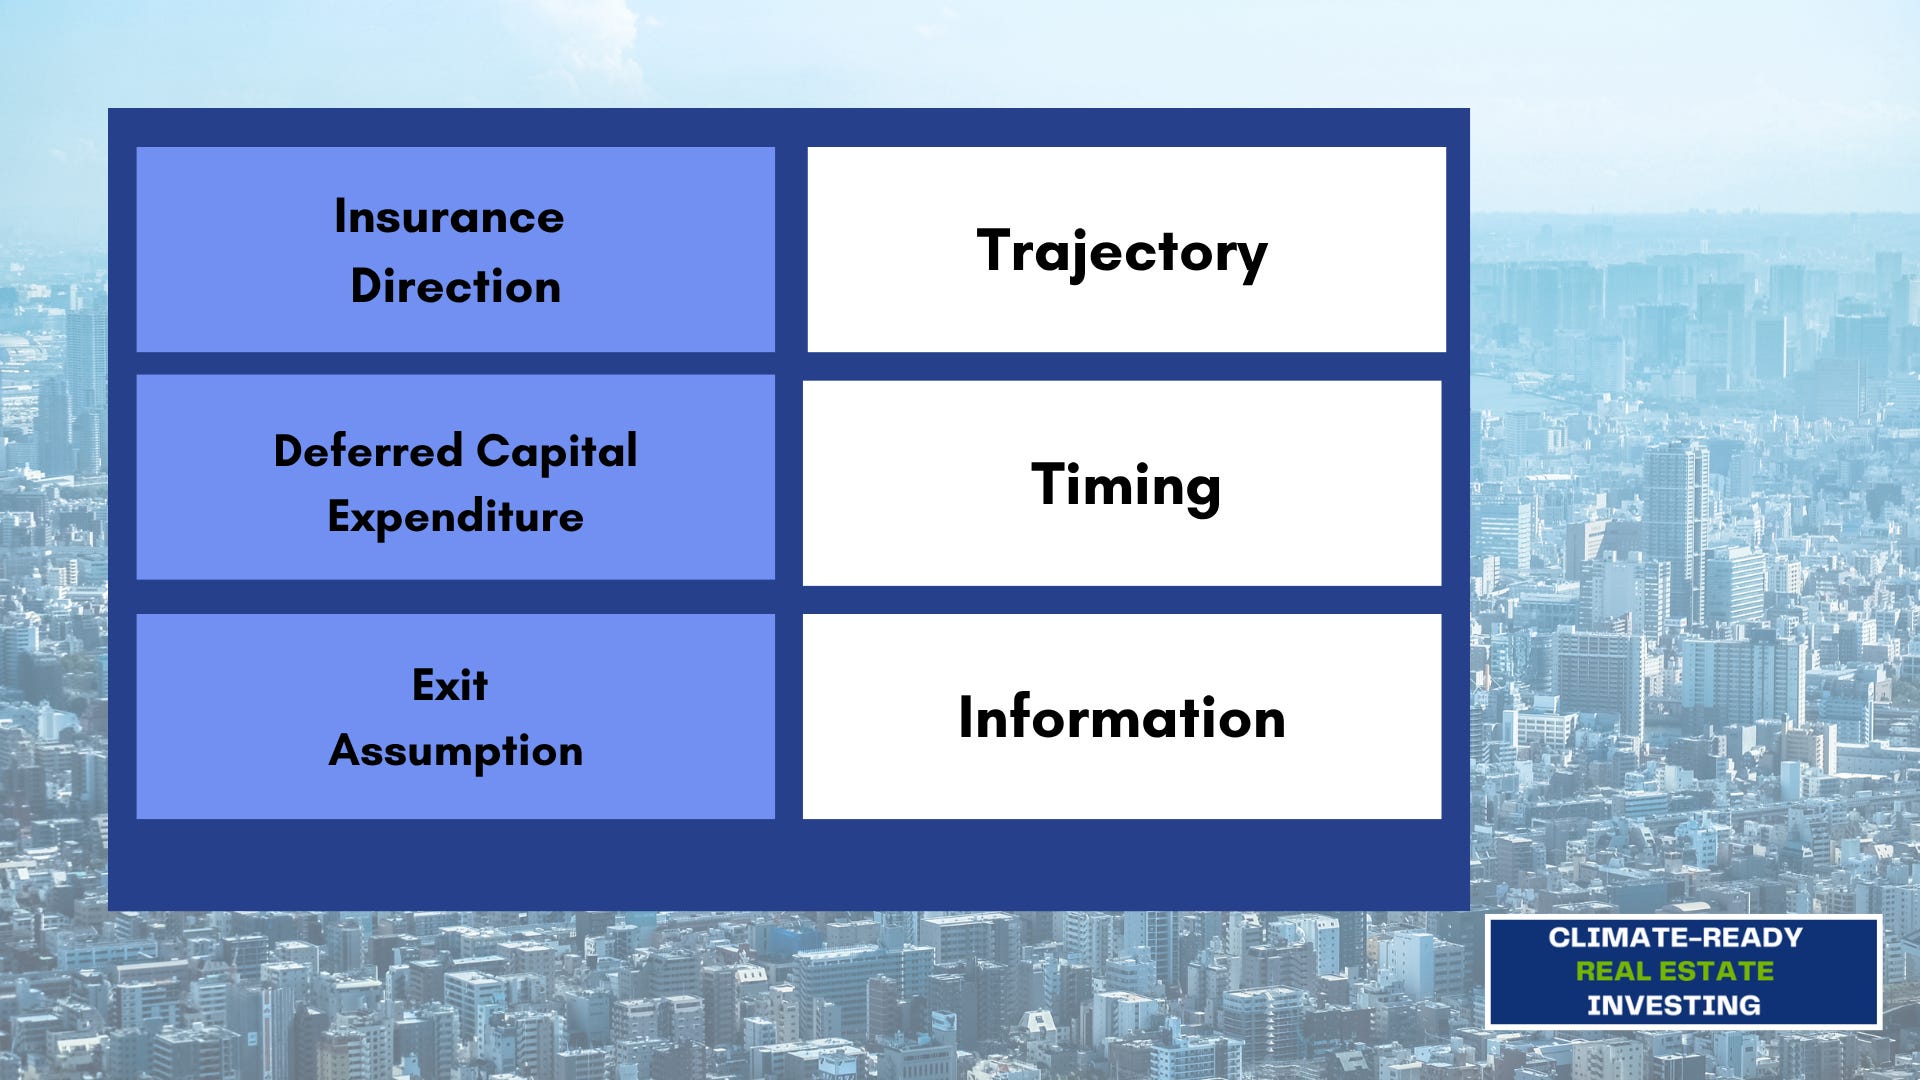
Hidden cost one is the insurance trajectory.
The pro forma carries property insurance at $1,180 per unit per year escalating at 3% annually. That $1,180 is this asset’s own in-place cost, a deal-specific input rather than a market average. The market benchmark is separate: Yardi Matrix puts Houston multifamily insurance at $1,115 per unit as of January 2024. Set the two side by side, and the deal starts modestly above the benchmark, about 6% above it. That is what you would expect. An older wood-frame asset in a flood-exposed Houston submarket underwrites above a metro-wide average, and that is normal rather than a weakness in the deal.
The exposure is not the starting point. It is the escalator. Model a 10% annual trajectory for five years and then flatten to 3%, which is conservative against Houston, where Yardi Matrix recorded a 40.4% increase in the twelve months to January 2024. Over the seven-year hold, the modeled insurance expense is $1,990,206, compared with the broker’s $1,663,674 at the 3% escalator. That gap is about $327,000.
Houston does not have to borrow its trajectory from the Upper Midwest to prove that a 10% annual insurance escalator is conservative. Local data shows the repricing has been severe and sustained. Yardi Matrix tracked Houston multifamily property insurance surging 40.4% in a single 12-month period leading into early 2024, far outpacing historical baseline trends.
When multi-year compounding in high-risk Texas metros routinely hits double digits year after year, underwriting a flat or low single-digit insurance bump effectively subsidizes the pro forma with wishful thinking. Coverage is narrowing while baseline costs climb, meaning owners who try to force a 10% cap often do so only by accepting heavier windstorm and flood exclusions that shift severe balance-sheet risk back onto themselves.
Hidden cost two is deferred capital expenditure.
The deck budgets $2,400 per unit over the hold. In a market where the design storm has been revised upward by 38%, and the grid has demonstrated multi-day failure, the realistic budget covers drainage, roof, envelope, and backup power. That is closer to $4,100 per unit. At 184 units, the difference is roughly $313,000 over the hold relative to the pro forma
Hidden cost three is the exit assumption.
The broker holds the exit cap at 6.25%, only 45 basis points wider than going in. But the buyer in year seven underwrites the insurance line you are living through now, with seven more years of loss history and a lender applying its own climate overlay. A wider exit cap is not a pessimistic assumption. It is the same assumption the seller is currently making about you. A second reason the exit moves is arithmetic rather than sentiment. A permanently higher insurance line doesn’t stop at cash flow. It lowers year-eight NOI by $80,332, and at a 6.25% cap that is $1,285,308 of value, or 4.5% of basis, from the insurance line alone.
Run all three corrections and the 14.3% IRR lands at 10.0%. Carrying the corrected insurance into the exit NOI is worth 114 basis points, the capex correction 31, and the exit cap the remaining 284. The exit cap that produces that result is 6.98%, which is 73 basis points wider than the broker’s 6.25% and 118 basis points wider than the 5.80% going in. Round it to 7.0%, and the deal returns 9.9%. On a $28.4 million basis, that is a $37.4 million exit becoming a $32.3 million one. The property did not change. The pro forma was simply answering a question about 2020.
Underwriting Analysis
The instinct is to treat this as a haircut and negotiate price. That is the wrong first move, because two of the three corrections are not price problems.
The insurance line is a trajectory issue that directly affects returns; a one-time reduction won’t address the escalating costs, emphasizing its importance in underwriting decisions.
The capex line is a timing problem. Drainage and envelope work is not evenly distributed across a hold. It concentrates on the events that reveal it, which means the spend arrives in years when NOI is already under pressure and the reserve is already drawn down.
The exit cap is an information problem, and it is the only one that worsens over time. Every year the market gets better data, the spread between climate-exposed and climate-resilient assets widens. You are not underwriting today’s buyer pool. You are underwriting the buyer pool that exists after two more repricing cycles.
So the sequence matters. Before you model anything, get three documents from the analysis:
The current declarations page, not a broker’s summary. You want the actual limits, deductibles, and named exclusions. Wind and hail deductibles in Houston are frequently percentage-based, and a 2% deductible on a $28.4 million insured value is $568,000 before a carrier pays anything.
The renewal correspondence for the last three cycles. A carrier that has signaled non-renewal is selling you a repricing that the pro forma has not modeled.
The claims history, including denied claims. A denied claim is still evidence of an exposure the property has already demonstrated.
Owners stress-test the exit because it is the number they were trained to stress-test, and the escalator because it moves every year. They are the same test. The escalator compounds across the hold and then lowers the terminal NOI the exit cap is applied to, so it hits the return twice. Test the escalator with the exit held flat, and you capture about a quarter of its effect.
Strategic Implications
The broader lesson is that the underwriting error lies elsewhere, not in the numbers. It is in the vintage of the assumptions.
The pro forma above is not intentionally misleading. Every line in it was defensible when the template was written. Insurance escalating at 3% was a reasonable assumption in 2019. A $2,400-per-unit capex reserve was reasonable before the design storm revision.
The failure mode is that reasonable assumptions are carried forward as defaults, and nobody re-derives them because they were once true.
On the cost side, expect the pressure to continue rather than revert. CenterPoint proposed a $5.75 billion system resiliency plan for 2026 through 2028, and Texas regulators approved a trimmed $2.7 billion version in August 2025. Utilities recover that capital through rates. The September 2024 transmission and distribution adjustment already moved the charge from 3.87 to 5.35 cents per kilowatt-hour, an increase of about 38%. That was a scheduled annual adjustment rather than storm recovery, which is exactly why it is the useful number. It shows the baseline cost of operating in this market rising independent of any specific event.
There is a counter-signal worth engaging rather than ignoring.
US commercial property insurance rate increases have been moderating, from 5.6% in Q4 2024 to 3.8% in the middle of 2025 and 2.9% by Q4 2025, according to a ULI roundtable of more than thirty real estate, finance and insurance leaders convened with IBHS and the CRE Finance Council.
This sounds great! Until you look more carefully. It describes a deceleration in the rate of increase, not a price decrease. Rates are still climbing, just less steeply. Participants in that same session warned the softening is cyclical and reverses with the next major event, and that it varies by coverage type, asset class, and jurisdiction. And it does one no good to have a premium increase on a gentler slope when the cliff of policy cancellation is still just ahead.
More to the point, it doesn’t address the argument above. A softer property rate environment does not change a design storm that was revised upward by 38%, does not restore a wind exclusion a carrier has already added, and does not change what a year-seven buyer will pay for a flood-exposed Houston asset. Price is cyclical. Availability and physical exposure are not.
The same session found something an operator can act on immediately.
Supplying accurate COPE data, meaning construction, occupancy, protection, and exposure, along with secondary modifiers like roof material and construction type, produced both lower premiums and broader coverage for a participating commercial firm. Better documentation of what you own is the cheapest underwriting lever available, and almost nobody pulls it.
For anyone allocating across Sun Belt markets, the practical consequence is that insurance and utility trajectories now differentiate submarkets more than rent growth does. Two Houston assets with identical rent rolls and identical basis can produce materially different seven-year returns based on flood zone, construction type, roof age, and deductible structure. That spread used to be noise. It is now the deal.
Brief 1 established why the repricing is happening at the market level. Brief 5 applies the same arithmetic to a Sun Belt portfolio and shows what happens when the DSCR covenant, rather than the IRR, is the first to break.
As always, KNOW YOUR SIGNALS and BE CLIMATE READY!
Jamie
Run this on your own deal
The CRDF Deal Stress Test™ built for this brief takes your own pro forma and reruns it with climate-adjusted insurance, cap, and exit assumptions. Free, no signup: Brief 2 · CRDF Deal Stress TestTM (xlsx)
New to the framework? The blank master Signal Tracker and Deal Stress Test workbooks are at climatereadyre.com/tools.
Related briefs
Same signal (S4 Valuation & Appraisal Gap):
Brief 1 · Insurance Premium Hikes: Impact on Cap Rates & Property Value
Brief 5 · Sun Belt Multifamily Insurance and IRR: Climate Risk Behind a 207% Rise - link to come
Brief 14 · How to Build a Climate-Adjusted Pro Forma: Miami Multifamily at a 100% Insurance Increase - link to come
Next in sequence:
Brief 3 · Hoboken Property Values: The Impact of $230M Post-Sandy Flood Infrastructure - link to come
Sources
Every figure above, with the date the data covers, the date it was published, and the date I verified it.
Houston multifamily insurance market benchmark — $1,115 per unit per year, Houston multifamily, as of January 2024; +40.4% year over year, against a national average of $636 per unit, also as of January 2024. This is the market benchmark, not this deal’s insurance input.
Yardi Matrix — Matrix Research Bulletin: Multifamily Expenses, March 2024 · Data as of Jan 2024 · Published Mar 2024 · Accessed Sep 2026
Retrievable mirror of the same March 2024 bulletin cited for the national figures below. The bulletin carries both the $1,115 per-unit Houston benchmark and the +40.4% year-over-year Houston increase, each as of January 2024.
Texas multifamily per-unit cost, secondary check — broker guide consulted for Texas per-unit ranges; it reports Houston insurance up 31.6% in the twelve months to June 2023 and carries no Houston per-unit dollar figure.
Texas Multifamily Quotes — Texas Multifamily Insurance Cost Per Unit: 2026 Benchmarks · Data as of 2024, with 2018–2019 context · Published date not stated; page last updated Aug 2026 · Accessed Sep 2026
Commercial broker marketing page. It does not support the $1,115 benchmark; that figure comes from Yardi Matrix above.
National Apartment Association — Premium Pulse · Data as of 2021–2024 same-store, 22 metros · Published 2026 · Accessed Sep 2026
The page returns HTTP 403 on retrieval, so the figure is unverifiable. Listed only to record the withdrawal.
Texas homeowners insurance market, background — statewide premium and availability context; no figure in this brief depends on it.
Texas Department of Insurance — Texas homeowners insurance market overview · Data as of 2015–2025 · Published date not stated · Accessed Sep 2026
Homeowners lines, not multifamily. Background only.
Texas property and casualty reports, background — index of TDI claim, premium and loss reporting; no figure in this brief depends on it.
Texas Department of Insurance — Property and Casualty Reports · Data as of period not stated · Published date not stated; page last updated Jun 15, 2016 · Accessed Sep 2026
Index page rather than a dataset. Background only.
National multifamily insurance expense growth — +27.7% year over year; +129% since 2018 to ~$636 per unit, as of January 2024.
Yardi Matrix — Multifamily Expenses Research Bulletin · Data as of Jan 2024 · Published Mar 2024 · Accessed Aug 2026
Upper Midwest multifamily premium increases — +14% (2021–22), +22% (2022–23), +45% (2023–24); ~⅓ of respondents carry more wind/hail exclusions than three years prior. Survey of 35 owners, ~45,000 units, in MN, MT, ND, and SD.
Federal Reserve Bank of Minneapolis — Rising property insurance costs stress multifamily housing · Data as of 2021–2024 · Published 2025 · Accessed Aug 2026
Caveat: Upper Midwest only. Not a Gulf Coast or national figure.
Houston design-storm revision — 100-year 24-hour rainfall from ~13 in. to ~18 in., about +38%.
NOAA — Atlas 14 Volume 11 (Texas), post-Harvey revision · Data as of 2018 revision · Published Sep 2018 · Accessed Aug 2026
Hurricane Beryl outage scale — about 2.26M of more than 2.8M CenterPoint customers lost power; ~226,000 still out after eight days.
Houston Public Media — Houston power outages, Hurricane Beryl; The Texas Tribune — Texans without power after Hurricane Beryl · Data as of Jul 2024 · Published Jul 2024 · Accessed Aug 2026
CenterPoint transmission and distribution charge — 3.87 to 5.35 cents/kWh, about +38%, effective Sept 2024.
Houston Public Media — Houstonians’ electricity bills may be higher this month following a rate increase by CenterPoint · Data as of Sep 2024 · Published Sep 26, 2024 · Accessed Aug 2026
Caveat: this was the scheduled annual TDU adjustment, not storm-cost recovery.
CenterPoint system resiliency plan — $5.75 billion proposed for 2026–2028; approved by the Texas PUC at $2.7 billion on August 21, 2025.
Utility Dive — Texas regulators trim, approve $2.7B CenterPoint system resiliency plan · Data as of Aug 2025 · Published Aug 25, 2025 · Accessed Aug 2026
Approved amount. The $5.75 billion is the original January 2025 filing, cut to $3.2 billion in a June settlement and to $2.7 billion by the commissioners.
US commercial property rate increases moderating — 5.6% (Q4 2024) to 3.8% (mid-2025) to 2.9% (Q4 2025); COPE data plus secondary modifiers produced both lower premiums and expanded coverage for a participating CRE firm.
Urban Land / ULI — How Better Property Data Can Improve Commercial Real Estate Insurance · Data as of Q4 2024–Q4 2025 · Published Jul 29, 2026 · Accessed Aug 2026
Roundtable held under Chatham House Rule; participants are unnamed by design.
184-unit Houston deal, modeled deal inputs — $28.4M basis, $154K/unit, 5.8% in-place cap, $1.65M Yr-1 NOI, 6.25% exit cap, $1,180/unit insurance at 3% escalation vs. modeled 10%, $2,400 vs. $4,100/unit capex, 14.3% IRR to ~10%.
CRREI modeled composite built on Houston submarket conditions · Method: three-variable correction to a broker pro forma over a seven-year hold, all other inputs held constant. Levered at 60% loan-to-value, $17,040,000 of interest-only debt at 6.25%, annual debt service $1,065,000. NOI grows 7.87% per year to year three and 4% per year after that. The capex reserve is spread evenly across the seven years. Exit is struck on year-eight NOI. The corrected insurance path is $1,990,206 versus $1,663,674 at the broker escalator, a $326,532 gap over the hold and a permanent $80,332 reduction in year-eight NOI. Solved exit cap rate: 6.98% · Modeled — not a specific transaction
The $1,180 per unit is a modeled, deal-specific insurance input for this composite asset. It is not a market average or a benchmark. The Houston market benchmark is Yardi Matrix at $1,115 per unit as of January 2024; the composite sits about 6% above it, consistent with an older wood-frame asset in a flood-exposed submarket.
Commentary and analysis only. Not investment, financial, legal, tax, or professional advice. CRDF tools are illustrative; examples are composites drawn from public data. Do your own due diligence and consult qualified professionals.
I run this analysis on specific deals. If you are underwriting a Gulf Coast or Sun Belt asset and want the insurance, cap, and exit assumptions pressure-tested before you sign, book 20 minutes.
Jamie Wolf, MBA — Founder & Publisher, Climate-Ready Real Estate Investing, © 2026, CR REI Holdings LLC