

Signals: S5 Acute Climate Hazard · S1 Insurance Repricing · S6 Chronic Climate Stress
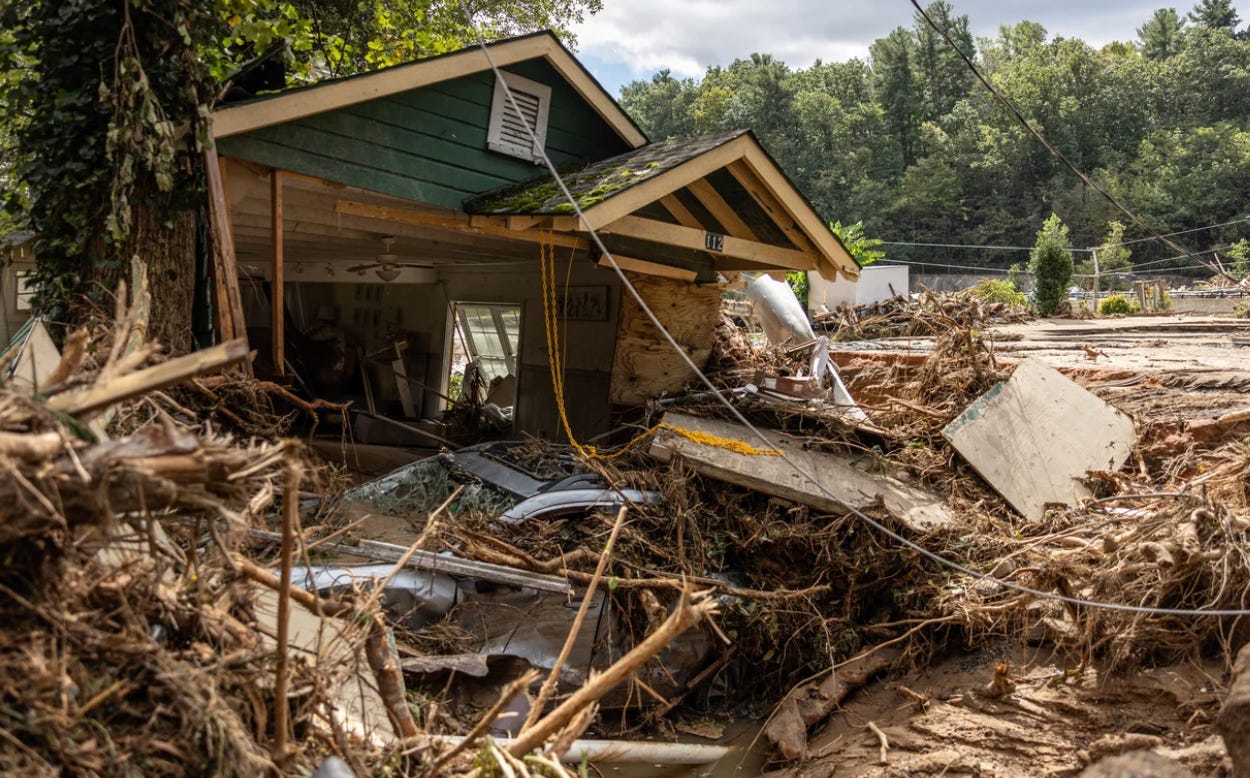
Photo Credit: Khadejeh Nikouyeh/The Charlotte Observer/Reuters
Before Hurricane Helene, an estimated 10.2% of commercial properties across western North Carolina carried FEMA-backed flood insurance.
Helene delivered more than 30 inches of rain to the mountains of western North Carolina, approximately 390-400 miles as the crow flies from where it made landfall.
Market Signal
Helene came ashore shortly before midnight on September 26, 2024, as a Category 4 storm near Perry, Florida, with 140-mile-per-hour winds and a 15-foot storm surge. It was the strongest hurricane on record to strike the Big Bend region and the deadliest to hit the US mainland since Katrina, with at least 250 deaths in the National Hurricane Center’s report.
Then it stopped being a Florida story. Over the following 48 hours, Helene tracked through western North Carolina and eastern Tennessee, delivering more than 30 inches of rain into mountain terrain roughly 400 miles from where it made landfall. Catastrophic flooding and landslides isolated entire towns.
Asheville is not a coastal market. People bought into it precisely because of its elevation, distance from the ocean, temperate climate, and long reputation as a climate haven.
Which is why almost nobody had flood insurance. Across western North Carolina, roughly 10.2% of commercial properties held FEMA-backed flood coverage before the storm.
That almost 90% not carrying FEMA coverage doesn’t represent negligence. Flood insurance is severable in the United States, and the mandatory purchase requirement applies only within designated special flood hazard areas. A commercial owner on a hillside in Buncombe County, outside any mapped zone, was not required to buy it, was not advised to buy it, and would have been paying for a risk that the governing map said did not exist.
The map answered a question about coastal storm surge and river flooding. The event was orographic rainfall on saturated mountain soil, a different hydrology that the mapping regime handles poorly.
The insurance market response has been more measured than most coverage suggests, and getting this right matters for anyone modeling the aftermath. North Carolina’s approved homeowners rate settlement produced increases of 4.4% in 2025 and 4.5% in 2026 for western North Carolina counties, against a statewide base rate increase of 7.5% in each year, totaling a cumulative 15% increase over a two-year settlement negotiated with the state. Insurers had originally sought 42% statewide and did not get it.
So the filed, approved, and regulated homeowners number is modest. Individual commercial renewals after a loss event are a different market, negotiated asset by asset with no rate filing behind them, and they have moved considerably more. Both facts are true, and they describe different things.
Deal Scenario
The following is a modeled composite based on a single-asset carrier repricing after a loss event, stated against the filed statewide rate context above. This is not meant to reflect an actual market rate or a specific transaction.
A 48-unit multifamily asset in the Asheville area, built in 2006, acquired months before the storm. The purchase price was $5 million at a projected first-year cap rate of 6.75%, resulting in a projected year-one NOI of $338,000. Insurance ran $65,000. Utilities ran $42,000.
The deal penciled. Nothing about the underwriting was careless. An inland mountain market with stable population growth and no coastal exposure is the kind of asset a conservative sponsor buys deliberately.
The model did not include a flood scenario because the parcel sat outside a mapped flood zone and therefore outside the mandatory purchase requirement. No lender demanded it. No appraisal flagged it. No comp suggested it.
After an event, three things likely move at once, and only the first is visible in the operating statement.
Insurance. Renewal on a post-event asset in a newly demonstrated hazard area is negotiated, not filed. Expect a step change rather than an escalator, and expect the carrier to ask questions it never asked before.
Capital expenditure. Stormwater compliance, site drainage, and any structural remediation arrive together. Asheville’s stormwater requirements are published and were tightened after repeated flooding. The five-year cost is deal-specific.
Exit. The buyer pool contracts to those willing to underwrite a market that has now demonstrated the hazard. That is the largest single value effect and the slowest to appear.
Run those together, and the return does not decline gradually. It steps down once at renewal and again at exit when the comp set has repriced.
The uninsured portion is what makes this different from an insured loss. An asset with flood coverage in place files a claim, absorbs a deductible, and rebuilds. An asset without it funds the entire repair from equity or from a lender willing to advance against impaired collateral. That is a capital structure event, not an operating one.
Underwriting Analysis
The failure here was not the model. It was the question the model was answering.
Every input in that pro forma was defensible. The error was treating “outside the mapped flood zone” as equivalent to “not exposed to flooding,” and those two statements are only loosely related.
So the analysis has to add a question that the standard diligence stack does not ask.
Get a modeled flood risk score, not only the FEMA designation. First Street’s modeling identifies 14.6 million US properties at substantial flood risk, roughly 70% more than the federal maps designated, on First Street’s June 2020 national assessment. The July 2025 update, High Water, High Stakes, puts it at 17.7 million properties at 1% annual flood risk against 7.9 million in FEMA Special Flood Hazard Areas, roughly 2.2 times. If the two disagree about your parcel, that disagreement is the finding. Since their July 2025 update, major inland flooding causing significant property damage in the US occurred in the Texas Hill Country in July 2026; the Catskills and mid-Hudson Valley (NY/New England) in July 2026; and Indiana, Kentucky, Ohio, and Arizona in August 2026.
Ask what the site’s upstream watershed looks like. Mountain and hill-country areas flood from above, not from a river rising. The impervious surface and the slope upstream of your parcel determine what arrives during an extreme rainfall event, and neither appears on a flood map. Similarly, it’s worth knowing whether you are downstream of any reservoirs, retention ponds, or even dams that may release water, causing flooding that would not otherwise occur.
Price flood coverage even when it isn’t required. In a region where 10.2% of commercial properties carry it, the premium is low precisely because the take-up is low. That is the cheapest point at which to buy the protection.
Ask when the governing maps were last revised. A map built from a rainfall record that predates the last decade of observations is describing a different climate.
A covered asset takes a deductible. An uncovered asset takes the full loss and applies it against equity. That difference is larger than any premium assumption you could make.
Strategic Implications
The portfolio lesson is that the word “safe” does unexamined work.
Investors have spent several years reallocating toward inland, elevated, temperate markets because they thought those places carried less climate risk. The reasoning is sound at the regional level but can be wrong at the parcel level because regional climate averages do not capture the hydrology of a specific valley.
Asheville, Western North Carolina, and the Southern Appalachians appeared on every climate-haven list published between 2018 and 2024. That is not a reason to avoid them. It is a reason to underwrite them with the same rigor applied to a Gulf Coast asset.
The specific discipline that follows is to separate two things that get discussed as one. Regional climate exposure is what you screen for when you select a market. Parcel-level hazard is what you underwrite when you buy a building. Getting the first right doesn't accomplish the second, and the market that felt safest is the one nobody looked at more closely.
The demand-side question decides a five-year hold, and it runs opposite to the damage.
Climate-haven markets grew as people moved to them. A single catastrophic event usually doesn’t reverse that, and rebuilding itself creates near-term demand as displaced households need somewhere to live. Rent can rise in the 18 months after a disaster even as values fall, producing a confusing operating statement.
The longer-term outcome depends on whether the market can still insure and finance itself once rebuilding stops. A place that recovers with coverage intact keeps its buyer pool. A place that recovers into an insurance market that has repriced or withdrawn is holding the same buildings against a smaller set of people who can own them.
That is the variable to track, and it takes several years to resolve. It also means the worst time to judge a post-event market is during reconstruction, when operating numbers are temporarily inflated.
There is also a pricing opportunity here. In markets where insurance take-up is low because the hazard is unpriced, the cost of buying the protection is correspondingly low. An owner who carries flood coverage in a region where nine out of ten owners across western North Carolina do not has bought a very cheap option on being the only financeable asset after an event.
One last point about the map itself. FEMA designations govern mandatory purchase requirements and were primarily developed for riverine and coastal flooding. Orographic rainfall on steep saturated terrain is a hydrology the mapping regime was not designed around, which is why the designation and the actual exposure diverged so widely here. Treat the federal map as a legal boundary rather than a risk assessment.
Brief 9 showed the same failure at market scale in Valencia. Brief 12 looks at how disclosure regimes are trying to force this exposure onto balance sheets before the event rather than after.
As always, KNOW YOUR SIGNALS and BE CLIMATE READY!
Jamie
Run this on your own deal
The CRDF Deal Stress Test™ built for this brief takes an inland asset and tests it against an unmapped flood scenario, an uninsured loss, and a contracted buyer pool. Free, no signup: Brief 11 - CRDF Deal Stress Test™ (xlxs)
New to the framework? The blank master Signal Tracker and Deal Stress Test workbooks are at climatereadyre.com/tools.
Related briefs
Same signal (S5 Acute Climate Hazard):
Brief 9 · Valencia Flood 2024 and Property Risk Maps: 491mm in Eight Hours
Brief 6 · The 30-Year Mortgage and Climate Risk: What the LA Fires Exposed About Loan Duration
Brief 3 · Hoboken Property Values: The Impact of $230M Post-Sandy Flood Infrastructure
Next in sequence:
Brief 12 · Climate Disclosure Rules for Real Estate in 2026: CSRD, SB 253, and What Changed - coming soon
Sources
Every figure from above includes the date the data covers, the date it was published, and the date I verified it.
Commercial flood insurance take-up — approximately 10.2% of commercial properties and 5.2% of homes across western North Carolina held FEMA-backed flood insurance before Helene; NC Newsline attributes the estimates to FEMA and North Carolina Department of Insurance data without naming the dataset or its vintage
NC Newsline — Few were insured against Helene’s floods; those that were faced long claims, frustrating hurdles · Data as of Sep 2024 · Published Apr 22, 2025 · Accessed Aug 2026
Hurricane Helene landfall and impact — Category 4 near Perry, Florida on September 26, 2024, 140 mph winds, 12- to 16-foot storm surge; at least 250 deaths (176 direct); more than 30 inches of rain in western North Carolina, approximately 390 to 400 miles from landfall, measured straight-line
NOAA National Hurricane Center — Tropical Cyclone Report: Hurricane Helene (AL092024) · Data as of Sep 2024 · Published 2025 · Accessed Aug 2026
The larger mileage figure in circulation describes road distance, not distance from landfall. Straight-line distance from the Florida landfall to western North Carolina is approximately 390 to 400 miles.
North Carolina approved homeowners rate changes — western NC counties +4.4% (2025) and +4.5% (2026); statewide base rate +7.5% each year; insurers originally sought 42% statewide.
Blue Ridge Public Radio — North Carolina’s disaster risk is high. How does that affect home insurance premiums? · Data as of 2024–2026 · Published Mar 18, 2026 · Accessed Aug 2026
These are filed homeowners rates for western North Carolina rating territories, not Asheville-specific figures and not commercial rates. Commercial multifamily renewals are negotiated asset by asset with no rate filing behind them.
North Carolina rate settlement, supporting coverage — carries the Asheville and Buncombe territory figures, 4.4% for 2025 and 4.5% for 2026, 8.9% combined against the 21% the Rate Bureau proposed for the territory.y
Asheville Citizen-Times — Asheville homeowners insurance rate increases; future Helene impacts unknown · Data as of Jan 2025 · Published Jan 23, 2025 · Accessed Aug 2026
Publisher and publication date derived from the source URL.
Flood exposure beyond the federal maps — 14.6 million US properties at substantial flood risk, against the 8.7 million FEMA designates in Special Flood Hazard Areas, roughly 70% more
First Street Foundation — The First National Flood Risk Assessment · Data as of 2020 · Published Jun 29, 2020 · Accessed Aug 2026
The 70% is a comparison of two counts, 14.6 million against FEMA’s 8.7 million in Special Flood Hazard Areas, not an increase in risk. The figure is from the June 2020 assessment. It has since been superseded by First Street, High Water, High Stakes, July 2025, which gives 17.7 million properties at 1% annual flood risk versus 7.9 million in FEMA Special Flood Hazard Areas. MSCI acquired First Street in August 2026.
Asheville stormwater requirements — tightened compliance obligations following repeated flooding
City of Asheville — Stormwater, Development Services · Data as of 2025 · Published date not stated · Accessed Aug 2026
Requirements are published. Any five-year cost figure is deal-specific and modeled, not published.
48-unit Asheville asset — $5M basis at a 6.75% projected cap rate, $338,000 projected year-one NOI, $65,000 insurance, $42,000 utilities, with premium and exit stress applied at the asset level
CRREI modeled composite · Method: single-asset carrier repricing after a loss event, stated against the filed statewide rate context above · Data as of 2026 · Published date not stated · Modeled — not a market rate and not a specific transaction
Commentary and analysis only. Not investment, financial, legal, tax, or professional advice. CRDF tools are illustrative; examples are composites drawn from public data. Do your own due diligence and consult qualified professionals.
I run this analysis on specific deals. If you are underwriting an inland asset in a market everyone calls a climate haven and want the flood and insurance assumptions pressure-tested before you sign, book 20 minutes.
Jamie Wolf, MBA — Founder & Publisher, Climate-Ready Real Estate Investing, © 2026, CR REI Holdings LLC