

Signals: S12 Resilience Economics & Retrofit · S3 Capital Allocation Flows · S9 Zoning, Codes & Land Use
Hoboken’s post-Sandy flood program started with a $230 million federal award, and the full program has since reached roughly $480 million across federal, state, and local funding sources over more than a decade. The engineering results are documented and substantial. Since 2016, the H1 and H5 flood pumps have prevented flooding in roughly 88% of rainstorms.
The valuation result is the interesting part, because it is slower, quieter, and less flattering than the engineering result. That gap between what a city can build and what a market will pay for is the whole subject of this brief.
The Moment
On October 29, 2012, Sandy pushed the Hudson into a city of about 50,000 people, packed into 1.25 square miles. Around 80% of Hoboken went underwater. Roughly 500 million gallons sat in the streets, and because Hoboken is built in a bowl, the water had nowhere to drain. Private damage exceeded $100 million.
What followed was the part most cities skip. Hoboken did not rebuild what it had. It treated the flood as new information about what the site actually is.
That distinction matters for anyone underwriting in a coastal market, because it is the difference between a recovery and a repricing.
A recovery restores the pre-event assumption.
A repricing replaces it.
The Story
Hoboken entered HUD’s Rebuild by Design competition. The U.S. Department of Housing and Urban Development (HUD) awarded the $230 million in Community Development Block Grant Disaster Recovery (CDBG-DR) funds named at the top of this brief to the State of New Jersey for the multi-municipal project spanning Hoboken, Weehawken, and Jersey City. That federal award was the starting point, not the whole program.
The broader comprehensive program budget (encompassing Resist, Delay, Store, and Discharge components across the municipalities) is estimated at approximately $480 million. This includes the $230M federal grant, $100M allocated by the State of New Jersey, and roughly $150 million in local funding, low-interest loans via the New Jersey Infrastructure Bank, and city Open Space Trust funds.
It went into a distributed system. ResilienCity Park is the most visible piece. The 5-6 acre park opened in 2023 and was engineered to capture up to 2 million gallons of stormwater. It achieves this through a 1-million-gallon underground retention tank, plus an additional 1 million gallons of capacity in above-ground green infrastructure such as rain gardens and bioswales.
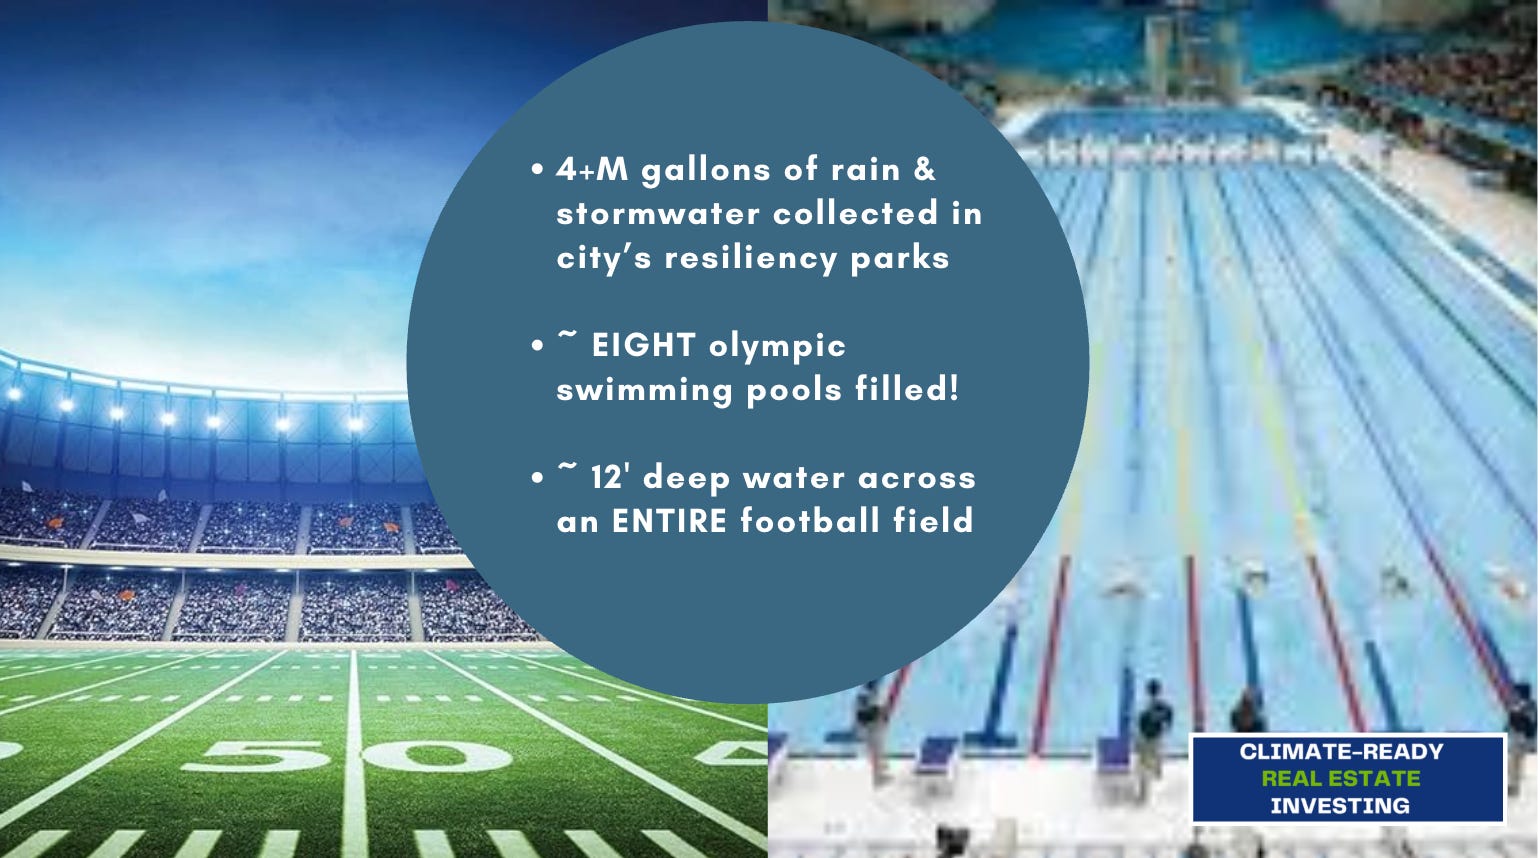
Across the city’s broader “Sponge City” network, which includes additional spaces such as the Southwest Resiliency Park and the 7th & Jackson Resiliency Park, Hoboken’s three completed resiliency parks can detain about 2.7 million gallons of stormwater between them, and during the storms of 2022 and 2023 they held up to 4.2 million gallons across events.
The measured outcome is the number that should interest capital. Since 2016, Hoboken’s H1 and H5 flood pumps have prevented flooding in roughly 88% of rainstorms.
Notice what the city bought. Not a guarantee against a Sandy-scale surge event, which no municipal budget can purchase. What it bought was the elimination of the ordinary, frequent, unremarkable flooding that makes ground-floor retail uninsurable, drives up deductibles, and slowly teaches a lender that a submarket is a problem.
That is a specific and underrated form of value. Catastrophic events are what get modeled. Chronic nuisance flooding decides whether a street can hold tenants.
The financing structure is worth noticing too.
Hoboken did not buy single-purpose infrastructure. It bought parks that happen to be detention basins. That matters because single-purpose flood infrastructure competes against every other municipal priority in every budget cycle and usually loses. Dual-purpose infrastructure gets funded as parks, maintained as parks, and defended politically as parks, while doing hydrological work beneath the surface.
For an investor, that signals the durability of the protection itself. A city is far more likely to maintain a beloved public park for thirty years than a concrete vault nobody visits. When you assess whether a municipality’s resilience claim will still hold at your exit, the question is not only what was built. It is whether anyone has a reason to keep it working.
Structural Forces
Three forces determine whether that engineering translates into asset value, and they operate on very different clocks.
The first is insurance, and it is the fastest.
FEMA’s Risk Rating 2.0 shifted the National Flood Insurance Program from zone-based pricing to property-specific, full-risk pricing. The direction of travel is documented. As of December 2022, the median annual NFIP premium was $689, but reaching full-risk pricing requires that median to rise to $1,288! That is an 87% increase to reach the actuarial number, and it is being delivered under a statutory cap of 18% per year.
Investors often misread the cap. It does not reduce the destination. It only stretches the timeline, which means the increase is scheduled rather than uncertain. Roughly 9% of policyholders will eventually need increases of more than 300%. GAO puts the five Gulf Coast states (Alabama, Florida, Louisiana, Mississippi, and Texas) in that highest-increase group because their historical policies were the most severely underpriced relative to actual flood risk, and they share the group with Connecticut, Hawaii, New Hampshire, New Jersey, and West Virginia. Those five Gulf Coast states together hold 61% of all NFIP policies.
For an owner, a capped increase is not relief. It is a known, compounding line item with a published endpoint, which is a strange kind of gift. You can model it.
The second force is capital, and it is slower and less obedient.
The best evidence on how a flood event affects values comes from Ortega and Taspinar in the Journal of Urban Economics, who use parcel-level sales data from New York City from 2003 to 2017, matched to geocoded FEMA damage data.
Their findings have two parts, and the second part is the one that should worry a coastal owner. Properties that Sandy damaged dropped 17% to 22% immediately, then partially recovered. Properties in the flood zone that were not damaged at all incurred a price penalty that gradually increased to about 8% by 2017, with no sign of recovery.
The undamaged properties did not bounce back because they had never taken a hit to bounce back from. What they took was a reassessment. The market learned something about the location and then held on to it, and a slow, permanent discount proved more durable than a sharp, temporary one.
That is why I am not going to claim Hoboken’s roughly $480 million program reversed its discount. The engineering evidence is strong and measured. The valuation evidence is not yet in, and the closest rigorous study on the same waterfront found a penalty that persisted for five years and counting. Anyone telling you resilience infrastructure has already been capitalized into coastal prices is ahead of the data.
What the data does support is narrower and still useful. Insurance availability responds to measured flood reduction faster than sale prices do, and insurance availability is upstream of financing, which is upstream of the buyer pool.
The third force is physical and the slowest of all.
Sea level along the US Gulf and Southeast coasts has risen roughly 0.4 inches, more than 10 mm, per year since 2010, roughly three times the global average and, according to the research team that documented it, unprecedented in at least 120 years. That is a Gulf and Southeast rate; the New York-New Jersey Bight, where Hoboken sits, lies north of Cape Hatteras, where the same study finds no comparable acceleration.
A city can engineer against rainfall. Engineering against a rising baseline is a different, more expensive problem, and it determines whether today’s infrastructure is a permanent solution or a thirty-year extension.
Next Chapter
Watch whether municipal resilience spending starts showing up as a credit and insurance variable rather than a civic virtue.
Early signs point in that direction. Carriers price at the parcel level now, and parcel-level pricing can recognize a stormwater system in ways a zone-based map never could. A city that can document flooding prevented in 88% of rainstorms has produced exactly the kind of evidence an underwriter can use, which is the same argument an individual owner makes with a certified retrofit.
The practical read for an investor is a diligence question, not a market call.
When you look at a coastal submarket, separate two things that usually get discussed as one.
Ask what the surge exposure is, which is a catastrophic and largely uninsurable-at-the-margin problem. Then ask separately what the chronic nuisance flooding picture looks like, and whether the municipality has funded and measured anything against it. The second question is where a resilience investment first appears, and it is rarely in the offering memorandum.
Hoboken is a useful case precisely because it is small, dense, and well documented. The water arrived. The city changed its assumptions rather than restoring them, and the flooding measurably stopped. Whether the market will pay for that is a question the data has not yet answered. It is worth watching, because when it does answer, it will answer for every coastal municipality at once.
Brief 4 widens the lens from one city to the asset class, and asks what happens when a $393 trillion market starts pricing the difference between durable and exposed geography.
As always, KNOW YOUR SIGNALS and BE CLIMATE READY!
Jamie
Go Deeper
This is a Story & Future Thinking brief, so there is no companion workbook. The blank master CRDF Signal Tracker™ and Deal Stress Test™ are free and available at climatereadyre.com/tools.
Related briefs
Same signal (S12 Resilience Economics & Retrofit):
Brief 29 · Wildfire Retrofit Cost vs Insurance Discount: What $23K to $100K Actually Buys - coming soon
Brief 30 · Rotterdam Flood Resilience Funding: The Delta Programme Is EUR 9 Billion Short - coming soon
Brief 32 · Real Estate Adaptation Capex: Capitalize vs. Expense Retrofits - coming soon
Next in sequence:
Brief 4 · How Much Does Coastal Hotel Insurance Cost? Florida Trends & Benchmarks - coming soon
Sources
Every figure above, with the date the data covers, the date it was published, and the date I verified it.
Sandy’s impact on Hoboken — ~80% of the city flooded; ~500 million gallons; more than $100M in private damage
City of Hoboken — Rebuild by Design-Hudson River Project FAQ · Data as of Oct 2012 · Published date not stated · Accessed Aug 2026
Hoboken population — 50,005 at the 2010 Census, the count in force when Sandy hit; 60,419 at the 2020 Census; 59,027 estimated for July 1, 2025
US Census Bureau — QuickFacts, Hoboken city, New Jersey · Data as of 2010–2025 · Published 2025 · Accessed Sep 2026
Federal resilience funding and stormwater capacity — ~$230M initial HUD award, ~$480M program to date; ResilienCity Park, 5 acres holding ~2M gallons
Rebuild by Design — New Jersey · Data as of 2013–2023 · Published 2023 · Accessed Aug 2026
Total program budget and funding split — $480M total: $230M federal CDBG-DR, $100M State of New Jersey, $150M City of Hoboken via Open Space Trust Fund and New Jersey Infrastructure Bank loans
Rebuild by Design — Hudson River Project: Resist, Delay, Store, Discharge · Data as of 2013–2025 · Published Oct 12, 2021, last updated Nov 4, 2025 · Accessed Sep 2026
New Jersey Department of Environmental Protection — Rebuild By Design Hudson River · Data as of 2021–2023 · Published date not stated · Accessed Sep 2026
Primary agency source, but the page has no publication or last-updated date so the phase status may have changed.
Resist segment scale and Northwest Resiliency Park capacity — an 8,846-foot series of hard infrastructure measures; the park stores and filters 1 million gallons of stormwater.
Rebuild by Design — Resist, Delay, Store, Discharge Hudson River Project 10-Year Update · Data as of 2012–2022 · Published Sep 1, 2022, last modified Oct 11, 2022 · Accessed Sep 2026
ResilienCity Park cost and detention capacity — $78M total cost ($10M FEMA BRIC grant, $24M municipal bonding, $44M state financing including $2M principal forgiveness); detains up to 2 million gallons via a 1-million-gallon tank plus 1 million gallons of above-ground green infrastructure
Results for America, Local Infrastructure Hub — ResilienCity Park Case Story (Hoboken, NJ) · Data as of Sep 2019–Fall 2023 · Published date not stated · Accessed Sep 2026
The document itself carries no publication date; only the host’s file path implies a March 2026 upload, which is not a stated publication date.
Hoboken’s sponge-city infrastructure in national coverage — the 1-million-gallon underground storage tank beneath ResilienCity Park and its pump station, described as critical stormwater infrastructure
North Hudson Sewerage Authority — Can Sponge Cities Save Us from the Coming Floods? · Data period not stated · Published Apr 9, year not stated · Accessed Sep 2026
Context only. This is the sewerage authority’s repost of a New Yorker feature; it carries no year on the date line and none of the network-wide storage or flood-reduction figures used above.
Measured flood reduction — ~flooding prevented in roughly 88% of rainstorms since 2016 by the H1 and H5 pumps; about 2.7M gallons of detention across the three completed resiliency parks (2M at ResilienCity Park, 670,000 at Southwest and 7th & Jackson together)
City of Hoboken — City and North Hudson Sewerage Authority announce major milestone in flood mitigation efforts · Data as of 2016–2025 · Published Apr 24, 2025 · Accessed Sep 2026
NFIP Risk Rating 2.0 pricing path — median premium $689 (Dec 2022) rising to $1,288 at full risk; 18% statutory annual cap; ~9% of policyholders eventually need increases above 300%; GAO places the five Gulf Coast states — Alabama, Florida, Louisiana, Mississippi and Texas — in the highest premium-increase group, along with Connecticut, Hawaii, New Hampshire, New Jersey and West Virginia; the Gulf five alone hold 61% of NFIP policies.
US GAO — GAO-23-105977, Flood Insurance: FEMA’s New Rate-Setting Methodology · Data as of Dec 2022 · Published Jul 31, 2023 · Accessed Aug 2026
Post-Sandy property value effects, New York City — damaged properties down 17–22% immediately with partial recovery; undamaged flood-zone properties developed an ~8% penalty by 2017 with no sign of recovery
Ortega & Taspinar — Journal of Urban Economics, vol. 106 · Data as of 2003–2017 parcel sales · Published 2018 · Accessed Aug 2026
Sea level rise, US Gulf and Southeast coasts — ~0.4 in./year, more than 10 mm/year, since 2010, roughly 3x the global average, unprecedented in at least 120 years; the acceleration is south of Cape Hatteras, not in the New York-New Jersey Bight
Dangendorf et al., Nature Communications, Rapid sea-level rise along the US Southeast and Gulf coasts · Data as of 2010–2022 · Published 2023 · Accessed Aug 2026
Commentary and analysis only. Not investment, financial, legal, tax, or professional advice. CRDF tools are illustrative; examples are composites drawn from public data. Do your own due diligence and consult qualified professionals.
I run this analysis on specific deals. If you are underwriting an asset in a coastal or flood-exposed market and want the insurance and exit assumptions pressure-tested before you sign, book 20 minutes.
Jamie Wolf, MBA — Founder & Publisher, Climate-Ready Real Estate Investing, © 2026 CR REI Holdings LLC