

Signals: S2 Credit & Mortgage Markets · S1 Insurance Repricing · S4 Valuation & Appraisal Gap
A thirty-year mortgage bets that a parcel’s risk profile will hold for thirty years.
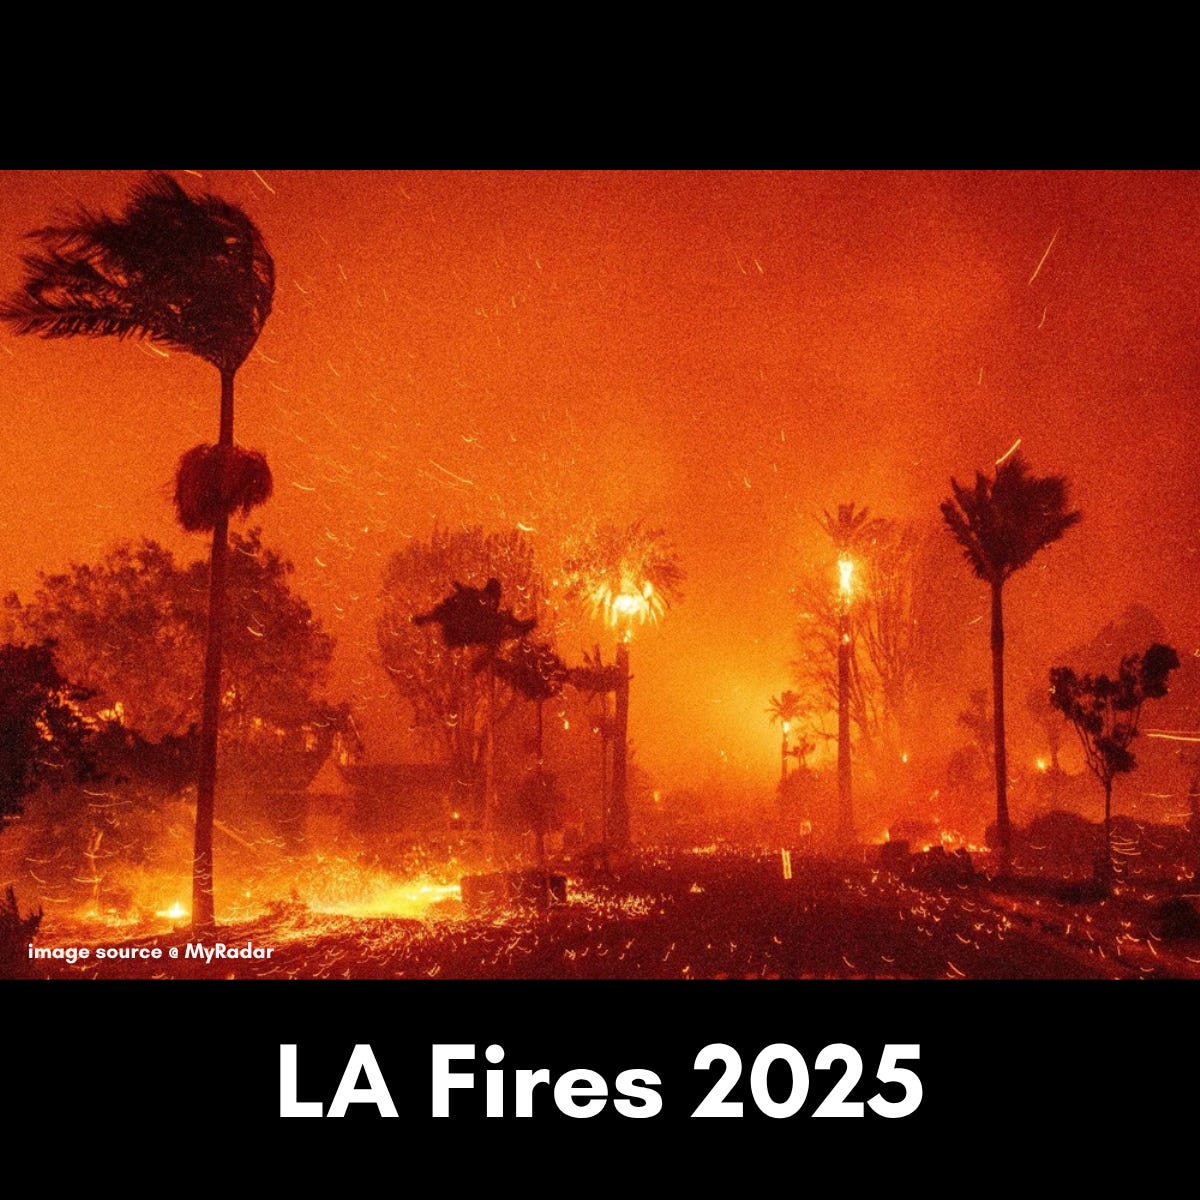
In January 2025, more than 16,000 structures burned in Los Angeles County. Most of those structures carried loans written on exactly that assumption.
The fires are the visible story. The loan-duration problem beneath them outlasts the news cycle. And given the extensive fire situation worldwide in 2026, sadly this problem will now be surfacing at an exponential rate.
The Moment
The Palisades fire started on January 7, 2025. The Eaton fire above Altadena started the same day, about twenty-five miles east.
By final count, more than 16,000 structures were destroyed, and 31 people had died. The economic loss estimates diverged sharply depending on what was measured. AccuWeather put total damage and economic loss at $250 to $275 billion. UCLA Anderson Forecast, which measures property and capital losses rather than the broader economic impact, put it at $76 to $131 billion, with insured losses up to $45 billion.
Those are not competing estimates of the same thing. One uses a broad economic-impact methodology, and the other is a property-loss calculation. Most coverage skipped the financing layer.
Several thousand active mortgages were likely held in that burn area. Redfin counted 5,449 homes destroyed inside the two perimeters; the CAL FIRE structure count cannot be used as a housing-unit count because it includes garages, sheds, mobile homes, commercial buildings, and schools. Treat it as an estimate and not a sourced data point.
Most of those were thirty-year fixed-rate loans. They originated under an assumption so ordinary that nobody wrote it down: that next year’s wildfire risk looks approximately the same as last year’s.
The Story
A mortgage is a duration instrument. The lender is not underwriting the borrower’s income alone. It is underwriting the collateral’s ability to remain collateral for the full term.
Three things have to stay true across those thirty years. The structure has to remain standing or rebuildable. The parcel has to remain insurable. And the market has to remain sufficiently liquid to attract a buyer if the borrower cannot pay.
The fires broke the first condition outright. The second and third conditions are perhaps more interesting, because those break without any fire at all.
Consider what a borrower faces after a total loss. Contractors reported that reconstruction in the affected Los Angeles submarkets ran roughly $400 to $700 per square foot, with bespoke and high-end work reaching $700 to $800 and above. Before the fires, building in Los Angeles averaged $400 to $500 per square foot.
Costs did not simply double. What changed is where a rebuild lands within that range, driven by code upgrades, fire-zone compliance requirements, and a labor market absorbing thousands of simultaneous projects.
The mortgage was sized against a structure built at the old cost. The insurance policy was written against a replacement value calculated the same way. Servicer forbearance buys time. It does not close a gap between what a policy pays and what a rebuild costs.
Colorado has already run this experiment at a smaller scale, and the results are documented.
The Marshall Fire destroyed 1,084 homes in Superior, Louisville, and unincorporated Boulder County on December 30, 2021. Not a wildland event. A suburban grass fire driven by hurricane-force winds through subdivisions.
Boulder County rebuilt faster than almost anywhere. The long-run national benchmark is roughly 25% of burned homes rebuilt within five years, based on an analysis of 106 fires between 2000 and 2005, so treat it as a floor rather than a current rate. The study ranked Kansas first, then California, Nevada, and Wisconsin. Against that benchmark, Boulder County’s pace is an outlier, not an ordinary western recovery. As of October 2025, nearly four years on, 74% of the destroyed homes had been rebuilt, and another 9% were under construction.
But the aggregate hid the distribution, and for a while it hid it badly. Three years in, Louisville and Superior were near 70% while unincorporated Boulder County sat at 34%. Three months later, by March 2025, the county had reached 63%. So the gap was pace, not outcome. Incorporated towns were mostly builder-grade subdivisions with repeatable floor plans. At the same time, the unincorporated county was nearly all custom design, and custom design takes longer to permit and longer to build. Keep the scale in view, too. Unincorporated Boulder County accounted for 156 of the 1,084 homes, so the slowest cohort accounted for 14% of the loss. And for a mortgage, pace is relevant. The loan does not pause while the permit does.
And underneath both is the number that actually explains who did not come back. In April 2022, 951 Marshall Fire total-loss claims were modeled against three rebuild costs: at $250 per square foot, 36% were underinsured by an average of $98,967; at $350 per square foot, 67% were underinsured by an average of $242,670, according to Colorado’s Division of Insurance.
A six-figure shortfall is not a rebuilding problem. It is a household balance sheet problem, and for a family holding a mortgage on a lot with no house, it is often unsolvable.
Vermont makes the same point from the opposite hazard, and it is the more uncomfortable case because Vermont is where people move to escape climate risk.
The state flooded in consecutive summers, and in 2023-2024 alone, it received six federal disaster declarations that collectively spanned all fourteen counties. These are not coastal towns or wildland interface subdivisions. They are the inland, temperate, high-elevation places that appear on every list of climate-resilient destinations.
A borrower who relocated to Vermont specifically to reduce exposure, and financed that move with a thirty-year loan, has discovered that the relevant risk was never the regional climate average. It was the specific hydrology of a specific valley.
Structural Forces
Fire is one route to a disaster declaration. Flood, drought, and heat are others, and the outcome is a loan whose term outruns the reliability of its collateral.
The first structural force is that flood exposure is far broader than the maps say. First Street, now part of MSCI, identifies 14.6 million properties at substantial flood risk in its June 2020 national assessment, roughly 70% more than FEMA designates. A property outside a designated zone is not subject to mandatory insurance requirements, which means the lender may be holding uninsured collateral without realizing it.
Second, the public backstop is not solvent in any ordinary sense. The National Flood Insurance Program owes more than $20 billion to the Treasury and has not been substantively restructured since 2014. Risk Rating 2.0 moved pricing toward full risk, but the statutory 18% annual cap means the transition will take decades, not years.
The third force is the most recent, and it moved in the opposite direction.
In October 2023, the Federal Reserve, the FDIC, and the OCC jointly issued Principles for Climate-Related Financial Risk Management, which apply to institutions with more than $100 billion in assets. On November 18, 2025, the agencies rescinded those principles. The agencies said existing safety and soundness standards already require institutions to manage all material financial risks, including emerging ones.
Read that carefully before deciding what it means. It is not a finding that the risk is absent. It is a decision that separate guidance is unnecessary because general prudential standards already cover it.
For an investor, the practical consequence is that supervisory expectations have become less explicit while the underlying exposure has not changed. Banks that built climate risk frameworks are unlikely to dismantle them. But the disclosure that would have let a counterparty see those frameworks is now discretionary, making lender behavior harder to anticipate as it becomes more consequential.
California moved the other direction. SB 261 required companies with revenue above $500 million to begin reporting on climate-related financial risks as of January 1, 2026. However, the U.S. Court of Appeals for the Ninth Circuit issued an injunction pausing its enforcement pending appeal, although many companies continue to build out their data.
State disclosure expanding while federal guidance is withdrawn is not a contradiction. But this fragmentation makes a national lending market hard to read.
Next Chapter
The thirty-year mortgage is not going to disappear. It is too embedded in American housing finance and too politically load-bearing. What changes is what gets attached to it.
Watch for the insurance requirement to become the binding constraint rather than the credit box. It already is in parts of California and Florida. A borrower with excellent credit and a strong down payment cannot close if the parcel will not place coverage, and that failure has nothing to do with the borrower.
Watch for term structure to start reflecting hazard exposure, most likely first in the non-agency and portfolio markets, where lenders retain the risk rather than sell it. A thirty-year fixed on a parcel with a deteriorating insurance outlook is a product a portfolio lender has good reason to reprice.
And watch the appraisal, because it is the slowest link. Appraisals are backward-looking by construction, based on comparable sales that have already occurred. If the market is repricing hazard exposure faster than comps can register it, the appraisal is documenting a market that no longer exists. That is the subject of Brief 36.
The summary is that geography was not the variable. Fire in California, flood in Vermont, heat in Europe, subsidence in Houston. Different hazards, different climates, one shared structure. A long-duration loan against a fixed parcel, priced on the assumption that the parcel’s risk profile is stationary.
That assumption was reasonable for most of the period during which the thirty-year mortgage was invented. The product, not the geography, needs rethinking.
Brief 5 showed what this looks like in a single-levered deal, where the covenant breaks years before the return does. Brief 7 follows the capital and asks where institutional money is actually going now that it can measure this.
As always, KNOW YOUR SIGNALS and BE CLIMATE READY!
Jamie
Go deeper
This is a Story & Future Thinking brief, so there is no companion workbook. The blank master CRDF Signal Tracker and Deal Stress Test are free and available at climatereadyre.com/tools.
Related briefs
Same signal (S2 Credit & Mortgage Markets):
Brief 10 · Bank Lending Criteria and Climate Risk on Property: The New Overlays - coming soon
Brief 22 · CMBS Spreads & Climate Risk: 77bp and 56bp per Point of Exposure - coming soon
Brief 23 · EPC Improvement Capex Financing for UK Industrial: EPC B by 2031 - coming soon
Next in sequence:
Brief 7 · Sustainable Real Estate Fund Flows and the Green Premium: $84B Went Out - coming soon
Sources
Every figure above includes the date the data covers, the publication date, and the date I verified it.
January 2025 Los Angeles fires — more than 16,000 structures destroyed; 31 deaths.
CAL FIRE — 2025 incident reports · Data as of Jan 2025 · Published 2025 · Accessed Aug 2026
Loss estimates — AccuWeather total damage and economic loss $250–275B; UCLA Anderson property and capital losses $76–131B; insured losses up to $45B.
UCLA Anderson Forecast — Economic impact of the Los Angeles wildfires; AccuWeather — total damage and economic loss estimate · Data as of Jan 2025 · Published 2025 · Accessed Aug 2026
The two figures measure different things. AccuWeather uses a broad economic-impact methodology; UCLA Anderson measures property and capital losses. Present both or neither.
Active mortgages in the burn area — several thousand; not quantified precisely.
CRREI — bounded by the Redfin count of 5,449 homes destroyed within the two perimeters; the CAL FIRE structure count spans non-residential structures and cannot support a mortgage count · Data as of Jan 2025 · Published date not stated · Accessed Aug 2026
Modeled — arithmetic, not a published finding.
Los Angeles rebuild construction cost — fire rebuilds $400–$700 per square foot, bespoke work $700–$800+; pre-fire Los Angeles average $400–$500 per square foot.
GreatBuildz — Cost to Build a House in Los Angeles (aggregated contractor bid reporting) · Data as of 2025–2026 · Published 2026 · Accessed Aug 2026
Contractor bid data is directional, not a published index. The pre-fire and post-fire ranges overlap; the increase is concentrated in code upgrades and high-end custom work rather than uniform across the market.
Marshall Fire scale and underinsurance — 1,084 homes destroyed December 30, 2021 (Louisville 550, Superior 378, unincorporated Boulder County 156); modeled underinsurance on 951 total-loss claims: 36% underinsured by an average of $98,967 at $250 per square foot, 55% by $164,855 at $300, 67% by $242,670 at $350; Colorado Division of Insurance, April 26, 2022.
Colorado Division of Insurance — Division of Insurance Releases Initial Estimates of Underinsurance for Homes in the Marshall Fire; Boulder Reporting Lab — Marshall Fire recovery, three years on (Dec 29, 2024), for the rebuild rates in the note below · Data as of Apr 2022 · Published Apr 26, 2022 · Accessed Aug 2026
Rebuild rates vary widely by jurisdiction and have fluctuated significantly. Three years on, Louisville and Superior were near 70%, and unincorporated Boulder County near 34%. By March 2025, the county had reached 63% rebuilt or permitted, against 90% in Louisville and 74% in Superior. No single county-wide rate exists, and jurisdictions do not all publish the same measure.
Marshall Fire rebuild progress — 74% of destroyed homes rebuilt with a further 9% under construction as of October 2025; 76% combined rebuilt or permitted as of March 2025 (Louisville 90%, Superior 74%, unincorporated Boulder County 63%).
Urban Institute — Rebuilding Better after the Marshall Fire; Boulder Weekly · Data as of Mar–Oct 2025 · Published Dec 2025 · Accessed Aug 2026
The jurisdictions publish different measures. Louisville reports rebuilt or under construction, Superior reports permits issued, and the county reports rebuilt or permitted. They are not directly comparable and should not be averaged.
Vermont repeat flooding — six declarations (DR-4720, 4744, 4762, 4810, 4826, 4816) that collectively spanned all fourteen counties.
FEMA — Disaster declarations · Data as of 2023–2025 · Published 2025 · Accessed Aug 2026
The fourteen-county reach is collective across the declarations, not per declaration. The state’s own count is five; the Vermont League of Cities and Towns lists six, and the six are used here.
National post-wildfire rebuild benchmark — roughly 25% of burned homes rebuilt within five years.
Alexandre and colleagues, International Journal of Wildland Fire — Rebuilding and new housing development after wildfire · Data as of 2000–2005 wildfires · Published 2015 · Accessed Aug 2026
Derived from 106 fires between 2000 and 2005, covering 3,604 destroyed structures. A long-run benchmark, not a current national rate. The paper publishes no state-level rate; its ranking puts Kansas first, then California, Nevada, and Wisconsin, with no number attached, and its highest rate is 63.8% for the 2003 fire year alone (Table 3).
Properties at substantial flood risk — 14.6 million, roughly 70% more than FEMA designates, as of the June 2020 assessment.
First Street — The First National Flood Risk Assessment · Data as of Jun 2020 · Published Jun 29, 2020 · Accessed Aug 2026
Traceability note: the June 2020 assessment reported 14.6 million properties at substantial risk, about 70% more than FEMA designates. The 24 million and 12 million pairing previously carried here was not from that assessment and had no stated source; it has been replaced with the June 2020 figures. First Street’s later work is collected at The Insurance Issue. Confirm which assessment the figure comes from before reuse.
NFIP Risk Rating 2.0 and the statutory cap — 18% annual cap on most increases; median premium $689 (December 2022) rising to $1,288 at full risk.
U.S. Government Accountability Office — GAO-23-105977 · Data as of Dec 2022 · Published Jul 31, 2023 · Accessed Aug 2026
Interagency climate risk principles rescinded — 88 FR 74183 (October 30, 2023) rescinded effective November 18, 2025; applied to institutions above $100B in assets.
Federal Register — Rescission of Principles for Climate-Related Financial Risk Management · Data as of Nov 2025 · Published Nov 18, 2025 · Accessed Aug 2026
California SB 261 — companies above $500M revenue must report climate-related financial risks; first reports due 2026.
California Legislative Information — SB 261, Climate-Related Financial Risk Act · Data as of 2026 · Published 2023 · Accessed Aug 2026
SB 261 is currently enjoined: the Ninth Circuit granted an injunction pending appeal on Nov 18, 2025, in Chamber of Commerce v. Sanchez, on First Amendment compelled-speech grounds. SB 253 was not enjoined and remains in effect.
Commentary and analysis only. Not investment, financial, legal, tax, or professional advice. CRDF tools are illustrative; examples are composites drawn from public data. Do your own due diligence and consult qualified professionals.
I run this analysis on specific deals. If you are underwriting an asset in a wildfire, flood, or heat-exposed market and want the insurance and exit assumptions pressure-tested before you sign, book 20 minutes.
Jamie Wolf, MBA — Founder & Publisher, Climate-Ready Real Estate Investing, © 2026, CR REI Holdings LLC