

Signals: S1 Insurance Repricing · S9 Zoning, Codes & Land Use · S12 Resilience Economics & Retrofit
For years, “build it stronger” was a values argument. It has become an underwriting one, and the carrier is writing the spec sheet.
Insurers have stopped only pricing damage after the fact and have started rewarding resilience before it occurs. In a global real estate market valued at $393.3 trillion at the end of 2024, that single shift flips the incentive running through the entire supply chain. What a carrier will insure, and on what terms, increasingly dictates what a developer specifies, what a builder builds, and what a manufacturer makes.
Market Signal
This is not a soft, values-driven trend.
Boards now treat insurability as a business-continuity input, a precondition for operating rather than a back-office line item. The World Economic Forum documented that board-level shift at the end of 2025, and Chubb frames climate resilience as core risk management rather than corporate citizenship.
The supply-side question underneath all three signals is simple. When the carrier writes the spec sheet, are you building to it?
Case Study
Start with the proof the spec works, because that is what lets a carrier underwrite it.
After Hurricane Sally came ashore on the Alabama coast in 2020, a peer-reviewed study from the University of Alabama’s Center for Risk and Insurance Research examined more than 40,000 insured properties. IBHS reports that homes built to the FORTIFIED standard, meaning a stronger roof, sealed deck, rated openings, and a continuous load path, had claim severity 15 to 40 percent lower and loss ratios 51 to 72 percent lower than standard homes, depending on designation.
But the number that should get a builder’s attention is not the damage figure. It is the claims data. FORTIFIED Roof homes filed 73 percent fewer insurance claims and posted a 72 percent lower loss ratio. For those properties built to the higher FORTIFIED Gold tier, it was 76 percent fewer claims and a 67 percent lower loss ratio.
That is not a brochure promise or a modeled projection. It is observed claims experience across 40,000 real policies, exactly the kind of evidence a carrier can put into a rate filing and reward with a discount, or with the simple decision to keep writing the policy at all.
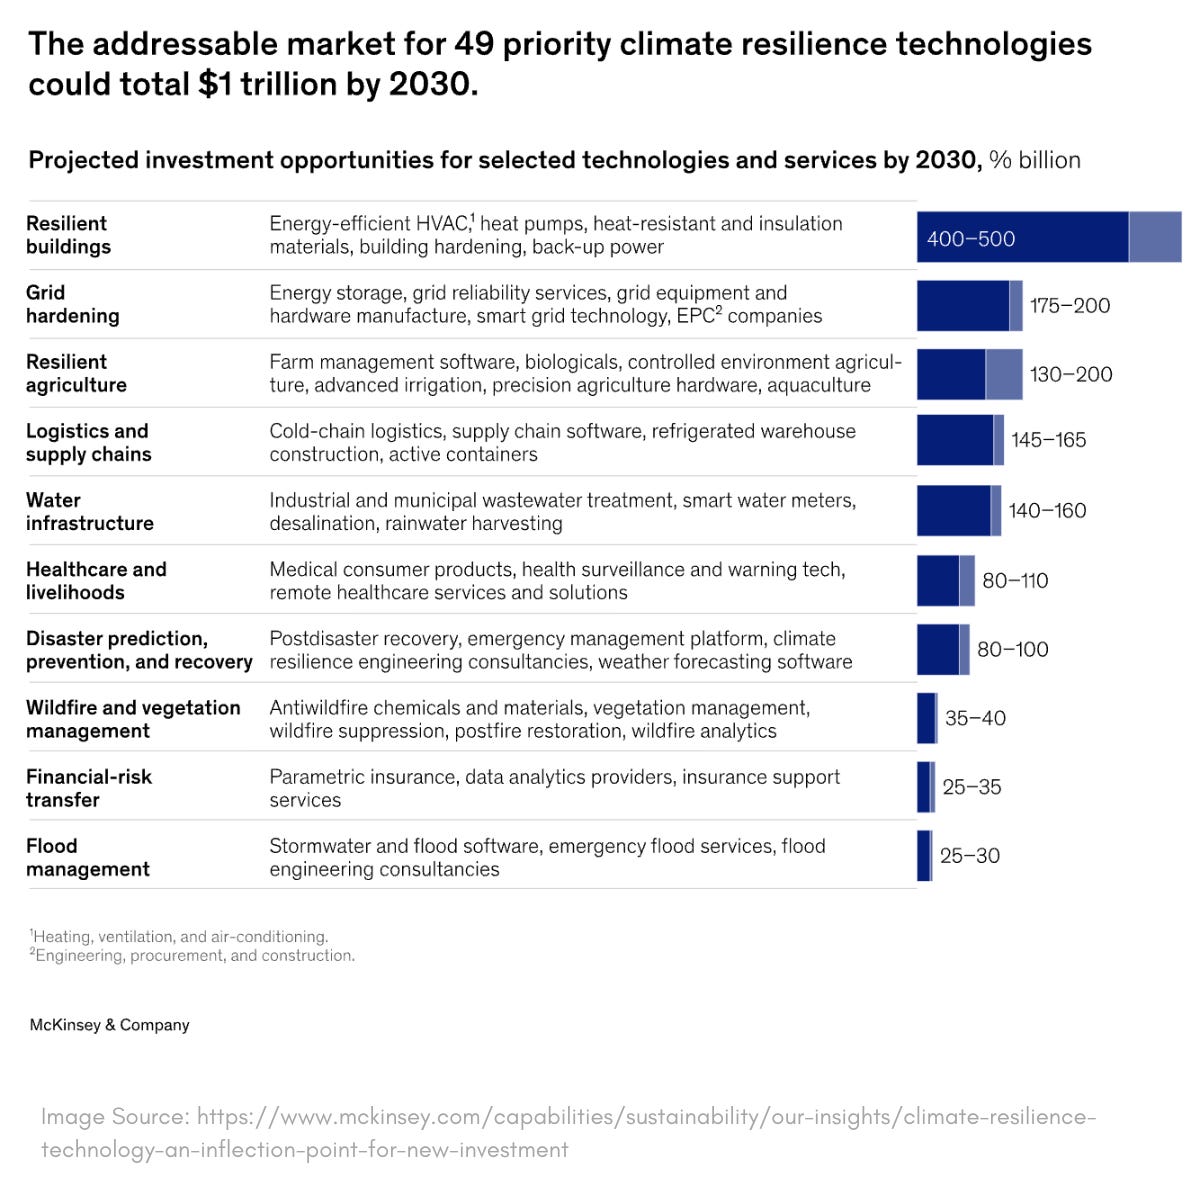
Now follow the capital, because it is moving toward that evidence. McKinsey estimates climate resilience and adaptation technologies represent an addressable market of roughly $600 billion to $1 trillion by 2030, growing 7 to 11 percent per year. Those are precisely the products the supply side makes.
So here is the opportunity and the threat. The builder or manufacturer whose product earns a carrier credit, or simply keeps the asset insurable, wins the bid. The one whose product cannot be insured is quietly designed out of the project.
For a manufacturer, “earning a carrier credit” is becoming concrete and testable rather than a marketing claim. It means a listed assembly, an impact or wind rating, tested fire performance, or an environmental product declaration. It is documentation an underwriter’s model can actually ingest. The FORTIFIED data is the template. When performance is measured on real claims and published, the carrier can price it, the lender can rely on it, and the developer can specify it with confidence.
Strategic Implications
Three forces are reshaping the supply chain around this signal, and they are arriving together.
Insurability is the new procurement filter (Signal 1). Where coverage is scarce or repricing fast, the insurable product wins by default. The developer specifies whatever keeps the asset insurable and financeable, and removes from the catalog any product that cannot be covered. That is not a future state. Carriers and boards already treat coverage as continuity risk, which means the underwriter increasingly makes the procurement decision one step before the architect.
The code is catching up to the carrier (Signal 9). Building codes and public-procurement rules are steadily mandating what carriers already reward. The supply side faces the same specification from two directions at once, namely the insurer who prices it today, and the code that will require it tomorrow. Building to the carrier’s standard is increasingly the same thing as building to the next code cycle, which makes the carrier’s reward an early warning system for where the code is headed.
Tariffs and shipping set the cost of compliance (Signal 12). None of this happens in a frictionless market. Under Section 232, the United States now carries 50 percent tariffs on imported steel and aluminum, and the pass-through is showing in the indexes. The producer price index for steel mill products is up around 13 percent, iron and steel roughly 10 percent year over year, and aluminum shapes by as much as a third. Cushman & Wakefield estimates overall construction-material costs are up about 6 percent against the 2024 baseline, pushing total project costs up around 3 percent.
The geography of that cost is the real story. Domestic US hot-rolled steel coil has traded above $1,200 per metric ton, more than double Southeast Asia’s roughly $570. That gap maps risk and opportunity at once. The supplier who can deliver compliant, resilient product reliably at a predictable landed cost captures a premium. The one exposed to a tariff line or a throttled shipping lane watches the insurance-grade spec become unaffordable.
Put the three together, and the playbook writes itself. Certify to the standard the carrier already rewards. Watch the code, because it is following the carrier. Engineer the supply chain so you can deliver compliant product at a knowable cost even when a tariff lands. Miss one and you are exposed by a great product you cannot deliver on time, a cheap product the carrier will not reward, or a compliant product priced out by a supply shock.
Future Signal
The shift to watch next is that resilience stops being a discount and becomes the price of admission.
Today, building to the insurance-grade spec earns a credit on the wind or fire portion of a premium. As parametric and mitigation-linked products mature, “insurance-grade” will increasingly be the minimum required to get a quote at all in exposed markets, and the supply side that has already certified will be the only one left in the room when the quote is written.
Expect three things now moving separately to converge into one specification: the carrier’s underwriting standard, the building code, and the public-procurement floor. When they line up, a manufacturer will design one global resilience spec and sell it everywhere. That is a forward-looking call, so treat it as directional. But the direction is not subtle.
Stakeholder Takeaway
Build to what the carrier rewards, because it is becoming what the market requires. Insurability is migrating from a cost you pay to a spec you sell against. Specify, certify, and lock your supply chain to that standard before the code and the carrier make it mandatory, not after.
As always, KNOW YOUR SIGNALS and BE CLIMATE READY!
Jamie
Run this on your own deal
The CRDF Signal Tracker™ built for this brief logs carrier-rewarded specifications against the assets and markets you actually hold, so you can see where an insurability requirement is arriving before it is written into a code cycle. Free, no signup: Brief 31 · CRDF Signal Tracker™ (xlsx)
New to the framework? The blank master CRDF Signal Tracker™ and Deal Stress Test™ workbooks are at climatereadyre.com/tools.
Related briefs
Same signal (S12 Resilience Economics & Retrofit):
Brief 26 · The True Cost of a FORTIFIED Roof: Insurance Savings & Storm Resilience
Brief 29 · Wildfire Retrofit Cost vs Insurance Discount: What $23K to $100K Actually Buys
Same signal (S1 Insurance Repricing):
Next in sequence:
Brief 32 · Real Estate Adaptation Capex: Capitalize vs. Expense Retrofits - coming soon
Sources
Every figure above includes the data coverage date, the publication date, and the date I verified it.
Global real estate value — $393.3 trillion at the end of 2024, down 0.5% year over year
Savills, Total Value of Global Real Estate · A broker’s modeled estimate of the asset class it earns fees in, and it fell year over year. Data as of end 2024 · Published Sep 29, 2025 · Accessed Aug 2026
FORTIFIED homes in Hurricane Sally — claim severity 15 to 40 percent lower, loss frequency 55 to 74 percent lower, loss ratios 51 to 72 percent lower across 40,195 policies
IBHS · Data as of 2020 · Published May 2025 · Accessed Sep 2026
FORTIFIED claims and loss outcomes — Roof: 73 percent fewer claims, 72 percent lower loss ratio; Gold: 76 percent and 67 percent
CRIR, University of Alabama Culverhouse · Data as of 2020 · Published May 2025 · Accessed Sep 2026
Climate-resilience technology addressable market — $600B to $1T by 2030; 7 to 11 percent CAGR
McKinsey · Data as of 2025 · Published Sep 29, 2025 · Accessed Sep 2026
Boards treat insurability as a business-continuity input — insurance products tied to board resilience.
World Economic Forum · Data as of 2025 · Published 2025 · Accessed Jul 2026
Climate resilience as core risk management, carrier side — resilience as continuity risk
Chubb · Data as of 2025 · Published 2025 · Accessed Jul 2026
Section 232 steel and aluminum tariffs raise construction costs — 50 percent tariffs; pass-through to inputs.
Construction Dive · Data as of 2025 · Published 2025 · Accessed Jul 2026
Tariff drag on construction and project costs — materials up about 6 percent against 2024; project costs up about 3 percent.
Cushman & Wakefield · Data as of 2026 · Published Apr 2026 · Accessed Sep 2026
Steel-price divergence — US hot-rolled coil about $1,201.50 per metric ton against about $571 in Southeast Asia; PPI steel products up 13.3 percent, iron and steel up 10.4 percent, aluminum up about 33 percent
S&P Global, via GMK Center · Data as of Jun 2026 · Published 2026 · Accessed Jul 2026
Supply-chain resilience in the climate era — resilient sourcing as a strategic input
MIT Sloan · Data as of 2024 · Published 2024 · Accessed Jul 2026
Commentary and analysis only. Not investment, financial, legal, tax, or professional advice. CRDF tools are illustrative; examples are composites drawn from public data. Do your own due diligence and consult qualified professionals.
I run this analysis on specific deals. If you are underwriting an asset in an exposed market and need the insurance and exit assumptions pressure-tested before you sign, book 20 minutes.
Jamie Wolf, MBA — Founder & Publisher, Climate-Ready Real Estate Investing, © 2026, CR REI Holdings LLC