

Signals: S12 Resilience Economics & Retrofit · S9 Zoning, Codes & Land Use · S5 Acute Climate Hazard
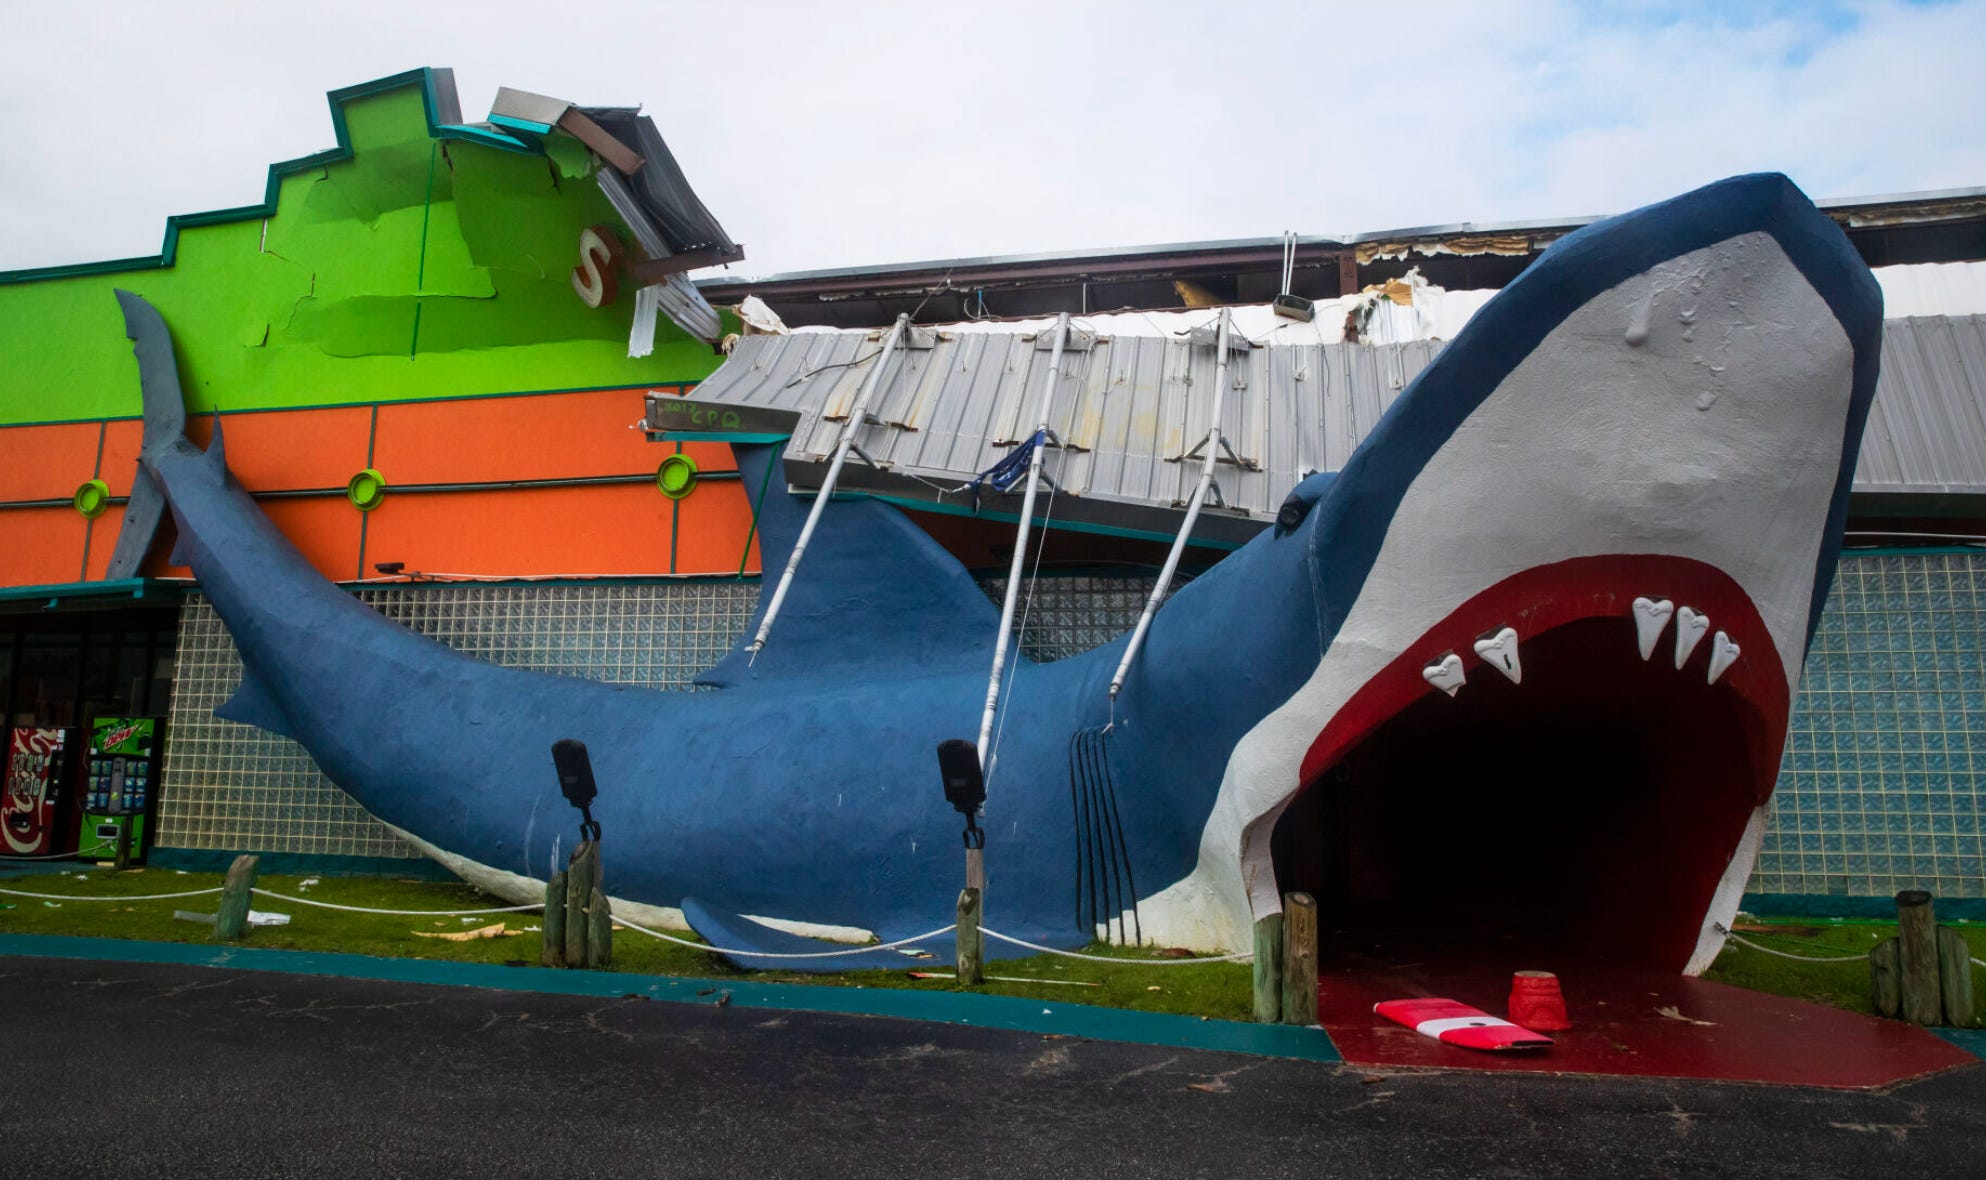
Photo Credit: Sophia Germer from NOLA.com / The Times-Picayune
The National Institute of Building Sciences puts the return on designing above code at $4 saved per $1 spent. That is the number a developer can actually underwrite.
Market Signal
Insurance pricing has moved from portfolio average to property-specific, which is what makes a spec sheet an underwriting input rather than a cost center.
Two changes did most of that work.
FEMA’s Risk Rating 2.0 has priced flood risk at the individual structure since new policies written on or after October 1, 2021, with renewals following from April 1, 2022.
The American Society of Civil Engineers published ASCE/SEI 24-24, its flood-resistant design standard, in 2024, expanding the flood hazard area to include the 500-year floodplain and tying design flood elevation to sea level rise.
Neither landed in 2025, and the distinction matters because a developer deciding what to specify this quarter needs to know whether they are early or four years late.
The performance evidence is now strong. A study, commissioned by the Alabama Department of Insurance and written by the Center for Risk and Insurance Research at the University of Alabama, matched 32,510 policies and 7,225 claims covering $149.3 million in paid losses after Hurricane Sally.
On a nearest-neighbor matched sample, FORTIFIED Roof construction showed 73% fewer claims, 15% lower claim severity, and a 72% lower loss ratio. FORTIFIED Gold showed 76% and 67%.
That is a controlled result on a large sample, and it is the strongest evidence in the resilience literature. It is also, on its own terms, a single-family result. The study’s data cleaning is explicit: “we dropped 600 mobile homes and 325 multifamily residences.”
Deal Scenario
Model a 120-unit wind-exposed coastal multifamily asset on a $30 million basis, a 6.0% going-in cap, $1.8 million of Year-1 net operating income, and a seven-year hold. This modeled scenario tests one decision, not a transaction.
The decision is a code-minimum envelope against an above-code envelope. That envelope includes a stronger roof deck and attachment, rated openings, and a continuous load path, for about $900,000, or 3.0% of basis.
Alabama’s wind mitigation discount schedule runs from 20% to 60% off the wind portion of the premium depending on designation and roof age. The Strengthen Alabama Homes program grants up to $10,000 toward a qualifying re-roof. The state offers a retrofit tax deduction of up to $3,000.
None of those apply to this asset. The Department of Insurance schedule states its own scope, “To qualify, the home must be a single-family, detached structure built on a permanent foundation. Townhomes, duplexes, and other multi-unit buildings will not qualify.” The grant program is limited to “existing, owner-occupied, single-family homes” and states plainly, “No rentals, no townhomes, no condominiums, or mobile homes.” The $3,000 is a deduction, not a credit, capped across all tax years and available only inside the coastal underwriting zone.
So a 120-unit rental building earns none of the discount, none of the grant, and none of the deduction. Any model that applies them to multifamily is modeling a single-family house 120 times.
What a multifamily owner does get is a standard and a negotiation. IBHS publishes FORTIFIED Commercial and FORTIFIED Multifamily, each carrying the same Roof, Silver and Gold tiers, and both are open for application. What IBHS does not publish is a price. Its own commercial materials say only that lower risk “may also help to reduce insurance costs,” which is the language used when no filed credit exists.
One jurisdiction is different. Florida requires that “a rate filing for residential property insurance must include actuarially reasonable discounts, credits, or other rate differentials” for windstorm mitigation, and Florida defines residential coverage to include “condominium association, cooperative association, apartment building, and similar policies.” So in Florida, the credit is legally owed to an apartment building. It is owed as an actuarially reasonable amount, not as a percentage off a chart.
Underwriting Analysis
State the inputs, then run the arithmetic, then say which line is doing the work.
Assume a wind and hail premium of $360,000 per year, which is 1.2% of basis and $3,000 per unit per year. Assume wind is 70% of that premium, and assume the above-code envelope negotiates a 25% reduction on the wind portion, which sits inside the range single-family schedules publish and is the sort of number a carrier will discuss on a documented commercial risk.
That is $360,000 multiplied by 0.70 multiplied by 0.25, or $63,000 per year of recovered net operating income.
Measured against the premium line alone, the spec does not pencil. $900,000 divided by $63,000 is a 14.3-year payback on a seven-year hold. Stop here, and the answer is no.
Now run the exit. Year-7 net operating income moves from $1.8 million to about $1.863 million. Hold the code-minimum twin at a 6.5% exit cap and the resilient building at 6.0%, on the argument that an insurable, documented asset sells to a wider buyer pool.
The code-minimum exit is about $27.7 million. The resilient exit is about $31.1 million. The swing is roughly $3.4 million against a $900,000 spec.
At an identical 6.5% cap the resilient building is worth $28.7 million, so the recovered income contributes about $1.0 million of the swing. The remaining $2.4 million comes entirely from the assumed 50-basis-point cap-rate compression.
No controlled study establishes a 50 basis point exit premium for above-code construction. It is an assumption only. Run the same deal at 25 basis points, and the swing falls to about $2.1 million. Run it at zero, and you are left with $1.0 million of income against a $900,000 spend, which is a marginal decision rather than an obvious one.
That is not an argument against specifying the above code. It is an argument for knowing which number you are actually betting on.
Run the checklist in this order, because the order matters.
First, is the code behind the hazard? Above-code spending earns its return only where local code lags the peril. Where the code has caught up, you are paying for something the baseline already delivers.
Second, is the asset insurable at all? For a coastal multifamily building, this is a binary, and it dominates every percentage below it. An uninsurable asset is unfinanceable and unsellable at any cap rate.
Third, what will the carrier actually credit, in writing? For multifamily, there is no schedule. Get the number from the underwriter before it goes in the model, and in Florida cite the statute.
Fourth, what is the downtime exposure, and does a parametric layer belong beside it? CCRIF paid roughly $45.8 million within eight days of Hurricane Beryl in 2024 to two governments, against a full event total of $84.5 million to seven members, including governments, utilities, and a tourist attraction. Parametric pays fast. It does not pay a loss. It sits beside the capital stack, not inside the policy.
Fifth, what is the grant and incentive capture? For a rental multifamily asset in Alabama today, the answer is zero.
Strategic Implications
The spec sheet is becoming a financing gate, and the evidence supporting it is outpacing the instruments that price it.
Carriers and lenders are converging on documented construction. What has not arrived for multifamily is a published credit, which means the entire benefit currently reaches the owner through negotiation, and negotiation rewards documentation. A manufacturer or builder who can hand you a designation, an inspection record and a materials trail is selling the thing that makes the conversation possible.
Watch the appraisal next, because that is where the 50 basis points either becomes real or does not. Most appraisals still treat two buildings of the same age and class as comparable when one is designated and one is not. As insurability data accumulates, that comp logic breaks, and the premium this model assumes becomes a premium someone can evidence. Until then it is a forecast wearing a cap rate.
The market is also sorting geographically. Where code lags the hazard and incentives are thin, resilience does not pencil, capital dissipates, and the market quietly divides into financeable and stranded. The developer’s edge is to be early in the places where the code gap and the carrier appetite line up, which today means Florida for multifamily and Alabama for anything single-family.
Finally, be careful with the benefit-cost literature. The $4 per $1 above-code figure is national and modeled across all hazards. A 2026 global synthesis of roughly 300 studies puts the average return on adaptation investment at about 4 to 1 as well, which is useful corroboration because it used a different method on different data.
As always, KNOW YOUR SIGNALS and BE CLIMATE READY!
Jamie
Run this on your own deal
The CRDF Deal Stress Test™ built for this brief lets you run your own spec delta against insurance, code and exit, with the cap-rate assumption exposed as an input you can set to zero and watch what happens. Free, no signup: Brief_26_CRDF Deal Stress Test™ (xlsx)
New to the framework? The blank master CRDF Signal Tracker™ and Deal Stress Test™ workbooks are at climatereadyre.com/tools.
Related briefs
Same signal (S9 Zoning, Codes & Land Use):
Brief 23 · EPC Improvement Capex Financing for UK Industrial: EPC B by 2031
Brief 15 · The Netherlands Label C Rule: How a Deadline Moved a Market to 78% Compliance
Next in sequence:
Brief 27 · Flood Zoning and Building Permits in Valencia: A EUR 4B Payout - coming soon
Sources
Every figure above, with the date the data covers, the date it was published, and the date I verified it.
Benefit-cost of above-code design — $4 saved per $1 spent; adopting current codes saves $11 per $1; federal mitigation grants save $6 per $1
National Institute of Building Sciences, Natural Hazard Mitigation Saves: 2019 Report · Data as of 2019 · Published Dec 1, 2019 · Accessed Aug 2026
FORTIFIED performance after Hurricane Sally — 73% fewer claims, 15% lower severity and a 72% lower loss ratio for FORTIFIED Roof; 76% and 67% for Gold; 32,510 policies, 7,225 claims, $149.3 million paid
Center for Risk and Insurance Research, University of Alabama, with the Alabama Department of Insurance · Data as of Sep 2020 policies and claims · Published May 5, 2025 · Accessed Aug 2026
Controlled by nearest-neighbor matching. The sample is owner-occupied single-family houses; the authors state that 325 multifamily residences were removed before analysis, so the result does not transfer to a multifamily asset.
Alabama discount and grant eligibility — the wind mitigation schedule runs 20% to 60% off the wind portion by designation and roof age, and excludes multi-unit buildings; the Strengthen Alabama Homes grant pays up to $10,000 and excludes rentals; the state retrofit deduction is capped at $3,000
Alabama Department of Insurance, Windstorm Damage Mitigation and Strengthen Alabama Homes · Data as of 2026 · Published 2014 and current · Accessed Aug 2026
The schedule states: “Townhomes, duplexes, and other multi-unit buildings will not qualify.” The grant states: “No rentals, no townhomes, no condominiums, or mobile homes.” The deduction is a deduction, not a credit, and applies only within the Alabama Insurance Underwriting Association zone.
Florida’s multifamily entitlement — residential property rate filings must include actuarially reasonable windstorm mitigation discounts, and residential coverage is defined to include apartment building and condominium association policies
Florida Statutes 627.0629 and 627.4025 · Data as of 2024 · Published 2024 · Accessed Aug 2026
The entitlement is to an actuarially reasonable discount in a filing. Florida’s FORTIFIED-specific pathway under 627.0629(9) is permissive and limited to personal lines.
FORTIFIED Commercial and FORTIFIED Multifamily — both published, each carrying Roof, Silver, and Gold levels, both open for application
IBHS FORTIFIED Commercial and IBHS FORTIFIED Multifamily · Data as of Aug 2026 · Published current · Accessed Aug 2026
IBHS publishes no insurance credit for either. Its own materials say lower risk “may also help to reduce insurance costs.” No designation count is published.
FEMA Risk Rating 2.0 — structure-specific flood pricing for new policies effective on or after October 1, 2021, and renewals from April 1, 2022
FEMA, Understanding Risk Rating 2.0 · Data as of 2021 · Published 2025 · Accessed Aug 2026
ASCE/SEI 24-24 — flood-resistant design and construction, published 2024, expanding the flood hazard area to the 500-year floodplain and tying design flood elevation to sea level rise
American Society of Civil Engineers, ASCE/SEI 24-24 · Data as of 2024 · Published 2024 · Accessed Aug 2026
ASCE states the standard is adopted by reference in model building codes without naming an edition. The 2024 I-Codes reference the 2014 edition, and ASCE 24-24 is proposed for the 2027 cycle. Confirm local adoption
CCRIF payouts after Hurricane Beryl — about $45.8 million confirmed within eight days to two governments; $84.5 million in total to seven members, including governments, utilities and a tourist attraction
CCRIF SPC, Annual Report 2024-2025 · Data as of policy year 2024-25 · Published 2025 · Accessed Aug 2026
CCRIF’s own service standard is payment within 14 days. The eight-day figure covers Grenada and Saint Vincent and the Grenadines, announced July 9, 2024.
Adaptation benefit-cost, global synthesis — an average benefit-cost ratio of about 4 to 1 across roughly 300 studies and more than 6,000 estimates
Grantham Research Institute, London School of Economics, The Macroeconomic Case for Investing in Climate Adaptation · Data as of 2026 · Published Jul 28, 2026 · Accessed Aug 2026
Produced with the Coalition of Finance Ministers for Climate Action. A global synthesis reached by a different method from the NIBS modeling, which is what makes the agreement useful.
The deal scenario — 120 units, $30 million basis, 6.0% going-in cap, $1.8 million Year-1 net operating income, seven-year hold, $900,000 spec delta at 3.0% of basis, $360,000 wind and hail premium with wind at 70% and a 25% negotiated reduction on the wind portion, exit at 6.0% against 6.5%
CRREI modeled scenario · Method: a single spec decision applied to an unchanged pro forma; premium recovery computed as premium multiplied by the wind share multiplied by the negotiated reduction; exit values capitalized at the stated caps with the cap-rate differential isolated and reported separately · Modeled — not a specific transaction
Commentary and analysis only. Not investment, financial, legal, tax, or professional advice. CRDF tools are illustrative; examples are composites drawn from public data. Do your own due diligence and consult qualified professionals.
I run this analysis on specific deals. If you are pricing an above-code envelope on a multifamily asset and the model is carrying a cap-rate assumption nobody has tested, book 20 minutes.
Jamie Wolf, MBA — Founder & Publisher, Climate-Ready Real Estate Investing, © 2026, CR REI Holdings LLC