

Signals: S5 Acute Climate Hazard · S6 Chronic Climate Stress · S4 Valuation & Appraisal Gap
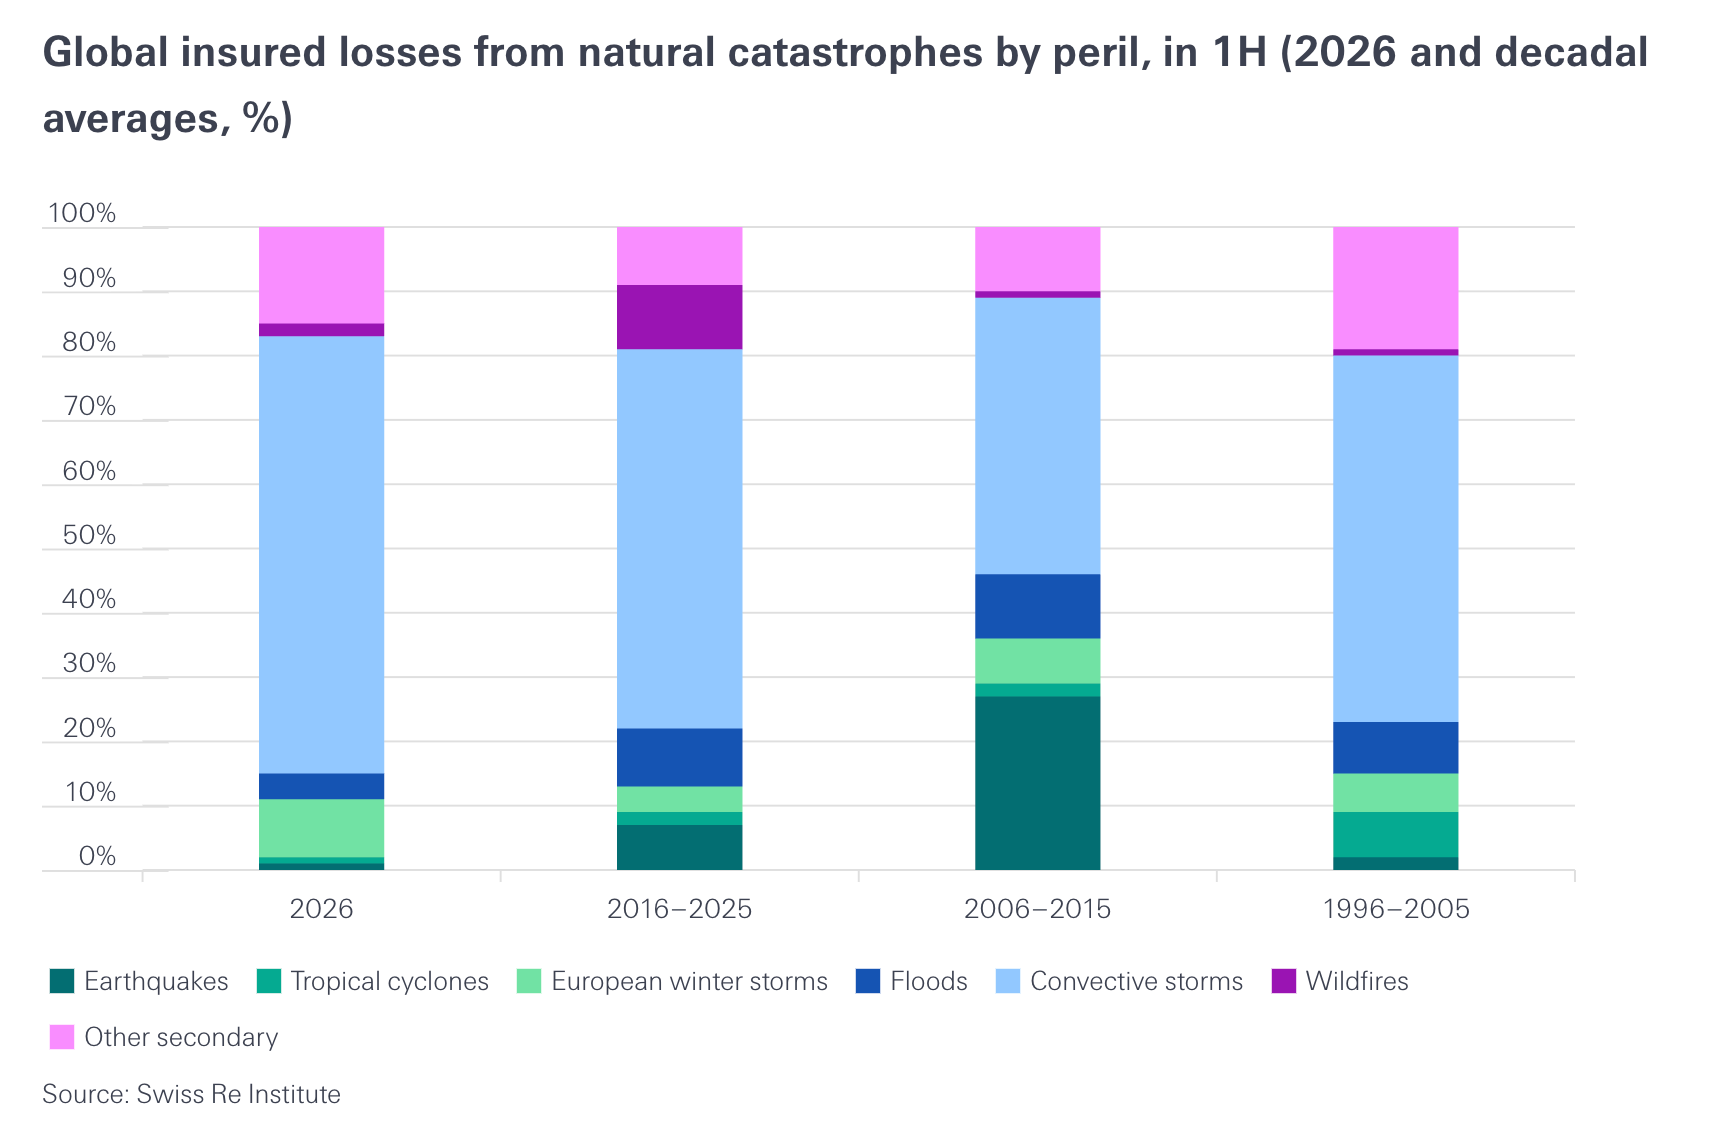
In the first half of 2026, storm activity ran about 20% above average and global insured catastrophe losses came in at $42 billion, the lowest first half since 2020.
West of Houston, a regional water authority has raised the fee it charges per thousand gallons from $0.50 in 2004 to $3.95 today because the ground beneath its service area is sinking and the regulator has ordered it to stop pumping.
The first number is what an acute year looks like when the storms miss the insured footprint. The second is what a chronic hazard looks like when it finally reaches an operating statement. Neither produced a claim, and only one is in your model.
Market Signal
Physical climate risk arrives on two clocks.
Acute risk is an event. A storm, a fire, a flood, on a single date, producing a single claim and a single repair bill. It is volatile, it is insured, and because it is insured, it is measured, reported, and priced within a year of happening.
Chronic risk is drift. Sinking ground, rising heat, retreating water. It accrues continuously as a slightly higher operating cost, a slightly earlier capital replacement, a slightly lower valuation, and it never produces the moment that forces a number down. It is rarely insured, so it is rarely measured, and what is not measured is not in the comps.
Start with the acute side, because 2025 and 2026 together show how little a loss total tells you about hazard.
Swiss Re Institute puts 2025 global insured natural catastrophe losses at about $107 billion against economic losses of about $220 billion, with the Los Angeles wildfires at roughly $40 billion and severe convective storms at $51 billion. Secondary perils accounted for 92% of insured losses. Aon’s separate tally runs higher, at $127 billion insured, with severe convective storms at $61 billion, the third-highest annual total on record for that peril.
Then the first half of 2026 arrived below trend. Swiss Re counts $42 billion of insured losses against a long-term trend estimate of $66 billion, with severe convective storm at $28 billion, the lowest since 2021. Aon puts first-half economic losses at $111 billion, 25% below the twenty-first-century average, with the United States accounting for 75% of global insured losses in a half-year whose largest single event was an earthquake sequence in Venezuela.
It carries different weight when you look at the two-year combination. Swiss Re’s own explanation for the quiet half is that storm activity ran about 20% above average and yet relatively few of the highest-impact events affected densely populated and highly insured areas. High frequency, low insured loss. That is not a calm year. It is a year whose losses landed where the insurance was not.
Which is the point about acute risk that most underwriting misses.
The loss total says where the storms went and who was insured. The hazard did not move. Swiss Re attributes more than 80% of the long-term rise in weather-related insured losses since 1970 to exposure growth, meaning more development with higher asset values in harm’s way, rather than to the climate signal itself.
So carriers price acute risk annually, based on a loss history that is itself noisy. Nobody prices chronic risk, and it arrives through a different door.
Case Study
Houston’s western suburbs show what that door looks like.
The Harris-Galveston Subsidence District runs a network of more than 190 GPS stations across the metro. Station P029, in Katy, has recorded about 35 centimeters, or about 14 inches, of subsidence since 2007, and from 2021 to 2025 it was still sinking at 2.64 centimeters a year. The fastest station in the network is P111, near Fulshear in Fort Bend County, at 3.31 centimeters a year. Both are on the western side of the metro, where growth has been fastest. The District’s Regulatory Area One, closer to the coast and converted off groundwater decades ago, shows rates below half a centimeter a year, so quoting the fastest stations as a regional rate overstates it several times over.
The peer-reviewed picture agrees on where the problem sits. Space geodetic measurements from 2015 to 2021 find Dallas, Fort Worth, and Houston have the highest proportion of sinking area among the largest US cities, with over 70% of their land subsiding faster than three millimeters a year.
Houston is the fastest of the group, with 42% of its land area subsiding faster than five millimeters a year and 12% faster than ten. San Antonio, Austin, and Houston together hold more than 82% of the buildings that the study rates at very high risk.
The cause is groundwater withdrawal, and that detail turns a geology story into an operating-cost story, because the regulator’s response to the cause is what reaches the property.
The District regulates by area. Regulatory Area One may draw no more than 10% of its annual water demand from groundwater, and Area Two no more than 20%. Area Three, which is the western growth corridor, has been on a conversion schedule that states no more than 70% groundwater through 2025, 40% from 2025, and 20% from 2035 for permittees on a certified reduction plan.
That schedule is why the West Harris County Regional Water Authority exists. It has no taxing authority. It buys and pipes surface water, estimates its conversion program at more than $1.5 billion, and recovers the cost through a fee on every thousand gallons its member districts pump or receive. In 2004, that fee was $0.50 per thousand gallons of groundwater. It rose in almost every year since, to $1.25 in 2010, $2.05 in 2015, $3.20 in 2020, and $3.95 in 2023, where it has stayed through 2026. Surface water is $4.35. The 30% conversion milestone was met in 2010 and the 60% milestone in 2025. The 80% milestone falls in 2035, and the fee schedule is the funding instrument.
Put that on a building. The following is a modeled illustration, not a transaction. A 300-unit garden apartment community in Katy using 100 gallons per unit per day draws about 11 million gallons a year. At the 2004 fee, the authority charged about $5,500 a year for that volume. At the 2023 fee it is about $43,000 on groundwater, or about $48,000 if the district has converted to surface water. That is roughly $40,000 a year of operating cost that did not exist when the asset was underwritten in 2004, before the property’s own utility rate. At a 6% capitalization rate, it is about $630,000 of value.
No storm produced it. No claim was filed. No catastrophe report lists it. A regulator ordered a region to stop sinking, and the cost of that order arrived on a water bill, in increments of twenty-five cents, for nineteen years.
That is chronic risk, and it is dangerous not because of its size. It is that every increment was small enough to absorb, and no one ever re-derived the line.
Strategic Implications
Model the two tempos in two columns that never merge. Underwrite acute risk for volatility, using the hazard multiplier, the deductible, the carrier count, and the claims history. Underwrite chronic risk for compounding drift, in the utility, insurance, and capital reserve lines, even when nothing hands you the number.
A compounding hazard modeled as a flat input is the most common error in a long hold. A pro forma carries a wind or fire multiplier because the last catastrophe-model update priced one. It rarely carries a drift for subsidence, cooling load, or water because those arrive as a trend that has to be modeled actively rather than inherited from last year’s template. It is the single most common reason a five-year hold underwrites cleanly and a ten-year hold does not.
Follow the regulator, not the geology. Subsidence, water stress, and heat reach an operating statement through a rule: a groundwater conversion schedule, an allocation cut, a cooling standard. Physical data usually precedes the rule by years, and the rule reprices the asset. The Harris-Galveston conversion milestones have been public since the 1990s. The 2035 step is already on the calendar.
Read the loss total as a map of who was insured, not as a measure of hazard. A below-trend year with above-average storm activity is not evidence that exposure fell. It shows the events missed the insured footprint that year. The next year’s renewal will not be priced off that half.
Date every dataset in the same paragraph. The geodetic study measures 2015 to 2021, the District’s station rates cover 2021 to 2025, the loss figures are full-year 2025 and first-half 2026, and the fee schedule runs 2004 to 2026. Mixing vintages is how a fast station becomes a regional rate and a quiet half becomes a trend.
Future Signal
Watch the modeling industry split its own product line, because that is where the two clocks are being separated for sale.
Cotality, formerly CoreLogic, now sells a chronic-perils product distinct from its catastrophe models. It notes 84 indices with property-level scores on a 1-to-100 scale across four chronic perils: cold wave, heat wave, extreme precipitation, and drought. Acute hazard - meaning flood, hurricane, earthquake, and severe convective storm - sits on a separate line. A client who has bought one has not bought the other, which is a vendor’s way of saying the two tempos are different risks with different data, and the industry has stopped pretending one model covers both.
The same separation is appearing on the insurer side. Moody’s catastrophe-modeling group published its own paper on heat and water stress in August 2026, sampling roughly 159,000 water-intensive US facilities and finding nearly 49,000 facing high or very high water stress in the coming decades, with Texas and California the most concentrated. Its head of catastrophe modeling described heat and water as perils that “are converging, and doing so quickly.”
What follows from that is a sequence, and it runs the same way for every hazard. A vendor scores a chronic peril. The score reaches a lender’s screen. The screen reaches a term sheet. Flood risk took decades and a federal program to run it. Chronic perils now have the vendor scores. They do not yet have the screen.
There are three things to watch.
Whether a lender writes a chronic-peril score into a credit policy, because the first one to do so sets the template.
Whether the Harris-Galveston 2035 milestone produces a fee step in the western authorities’ schedules, because that is the next chronic-cost increment already on a public calendar.
And whether the second half of 2026 returns acute losses to trend, because if it does, the first half will be remembered as what it was, a lucky map rather than a quiet climate.
Brief 5 ran the acute side through a levered Sun Belt deal and found the covenant broke before the return did. Brief 36 takes the chronic side to its conclusion and asks what an appraisal does with a hazard the comps cannot see.
As always, KNOW YOUR SIGNALS and BE CLIMATE READY!
Jamie
Run this on your own deal
The CRDF Signal Tracker™ built for this brief lets you log acute-event signals and chronic-drift signals side by side in two columns that never get modeled as one, and score which of them is actually moving your net operating income. Free, no signup: Brief 34_CRDF Signal Tracker™ (xlsx)
New to the framework?
The blank master CRDF Signal Tracker™ and Deal Stress Test™ workbooks are at climatereadyre.com/tools.
Related briefs
Same signal (S4 Valuation & Appraisal Gap):
Brief 5 · Sun Belt Multifamily Insurance and IRR: Climate Risk Behind a 207% Rise
Brief 1 · Insurance Premium Hikes: Impact on Cap Rates & Property Value
Next in sequence:
Brief 35 · Colorado Hail Roof Insurance: The New 0.5% Fee - coming soon
Sources
Every figure above, with the date the data covers, the date it was published, and the date I verified it.
First-half 2026 insured catastrophe losses, Swiss Re — $42 billion, the lowest first half since 2020, against a long-term trend estimate of $66 billion; severe convective storm $28 billion, the lowest since 2021; storm activity about 20% above average, with relatively few of the highest-impact events affecting densely populated and highly insured areas
Swiss Re Institute, first-half 2026 insured catastrophe losses · Data as of Jan to Jun 2026 · Published Aug 11, 2026 · Accessed Sep 2026
A reinsurer’s preliminary estimate of the market it underwrites. Munich Re, Gallagher Re, and Aon published first-half insured estimates of $44 billion, $46 billion, and $47 billion in the same weeks; the spread is narrow, and the direction is unanimous.
First-half 2026 economic losses and concentration, Aon — global economic losses $111 billion, 25% below the twenty-first-century average; the United States accounted for 75% of global insured losses; Venezuela earthquake sequence of June 24, 2026 at $20 to 30 billion economic; US severe convective storms $34 billion economic
Aon, below-average global catastrophe losses masked significant regional impacts, H1 2026 · Data as of Jan to Jun 2026 · Published Jul 22, 2026 · Accessed Sep 2026
A reinsurance broker’s proprietary catastrophe database. Aon frames it as: headline global loss figures can obscure where risk is actually accumulating.
2025 catastrophe losses, Swiss Re — global insured losses of about $107 billion against economic losses of about $220 billion; Los Angeles wildfires about $40 billion; severe convective storms $51 billion; secondary perils 92% of insured losses; more than 80% of the long-term rise in weather-related insured losses since 1970 attributed to exposure growth
Swiss Re Institute, sigma 01/2026 · Data as of full year 2025 · Published Mar 19, 2026 · Accessed Sep 2026
Swiss Re revised economic losses down from $233 billion in its December preliminary release to $220 billion in the final.
2025 catastrophe losses, Aon — total insured losses of $127 billion; severe convective storm insured losses of $61 billion, the third-highest annual total on record for that peril; the Palisades and Eaton fires at $41 billion
Aon, 2026 Climate and Catastrophe Insight · Data as of full year 2025 · Published Jan 2026 · Accessed Sep 2026
2025 was the third-highest severe convective storm year, below 2023 and 2024, so it is not on its own evidence of an accelerating trend.
Houston-area subsidence measurement — station P029 in Katy has recorded approximately 35 centimeters since 2007 and is sinking at 2.64 centimeters per year over 2021 to 2025; station P111 near Fulshear is the fastest in a network of more than 190 at 3.31 centimeters per year; Regulatory Area One rates below half a centimeter per year
Harris-Galveston Subsidence District, 2025 Annual Groundwater Report · Data as of 2021 to 2025 · Published Jun 2026 · Accessed Sep 2026
The District publishes no network-wide average. The fastest stations do not represent the region.
Harris-Galveston groundwater limits by regulatory area — Area One no more than 10% of annual water demand from groundwater; Area Two no more than 20%; Area Three no more than 70% through 2025, 40% from 2025, and 20% from 2035 for permittees with a certified groundwater reduction plan, with a 20% cap otherwise; a disincentive fee applies above the limit
Harris-Galveston Subsidence District, Regulatory Areas · Data as of 2026 · Published date not stated · Accessed Sep 2026
West Harris County Regional Water Authority fee — groundwater fee per 1,000 gallons of $0.50 in 2004, $1.25 in 2010, $2.05 in 2015, $3.20 in 2020, and $3.95 from 2023 through 2026; surface water $4.35 from 2023; conversion milestones of 30% by 2010 and 60% by 2025 met, 80% by 2035 pending; conversion cost estimated at more than $1.5 billion; the authority has no taxing power
West Harris County Regional Water Authority, Pumpage Fee History and Frequently Asked Questions · Data as of 2004 to 2026 · Published date not stated · Accessed Sep 2026
The fee is charged to the authority’s member utility districts, which pass it through inside their own water rates. The authority kept the fee flat in 2024, 2025, and 2026.
Texas subsidence in the peer-reviewed record — Dallas, Fort Worth, and Houston exhibit the highest proportion of sinking area among the 28 most populous US cities, with over 70% of their land subsiding faster than 3 millimeters per year; Houston: 42% of land area subsiding faster than 5 millimeters per year and 12% faster than 10; San Antonio, Austin, and Houston hold more than 82% of buildings rated very high risk.
Ohenhen and colleagues, Land subsidence risk to infrastructure in US metropolises, Nature Cities 2(6) · Data as of 2015 to 2021 · Published May 8, 2025 · Accessed Sep 2026
Peer-reviewed. The paper does not separate Dallas from Fort Worth; per-city detail is in its Supplementary Table 3. The national headline from the same paper is the subject of Brief 36.
Chronic-peril scoring as a separate product — 84 indices across four chronic perils, cold wave, heat wave, extreme precipitation, and drought, with property-level scores on a 1 to 100 scale; acute hazard sold in a separate catastrophe-modeling line
Cotality, Climate Risk Analytics: Chronic Perils · Data as of 2026 · Published date not stated · Accessed Sep 2026
A vendor product page with no research, figures, or methodology behind it. Cited only for the fact that the product line is split, not for any risk estimate.
Moody’s on heat and water stress — roughly 159,000 water-intensive US facilities sampled, nearly 49,000 facing high or very high water stress in the coming decades, concentrated in Texas and California; more than 60% heavy manufacturing and processing, about 25% food and beverage, about 14% mining and quarrying
Claims Journal, Moody’s says heat, water scarcity driving stranded-asset risks · Data as of 2026 · Published Aug 18, 2026 · Accessed Sep 2026
Trade-press coverage of Moody’s own whitepaper, The compound effect: heat, water, and the new risk landscape (August 2026), which describes the vendor’s own model. The quotation is from Mohsen Rahnama, head of catastrophe modeling at Moody’s Insurance Solutions.
Katy water-fee illustration — 300 units at 100 gallons per unit per day, about 11 million gallons a year; authority fee of about $5,500 at $0.50 and about $43,000 at $3.95 per 1,000 gallons; roughly $40,000 of added annual cost, about $630,000 of value at a 6% capitalization rate
CRREI modeled illustration · Method: the authority’s published fee applied to an assumed consumption volume, before the member district’s own rate and before any conservation; the 100 gallons per unit per day figure is an assumption, not a benchmark · Modeled — not a specific property
Commentary and analysis only. Not investment, financial, legal, tax, or professional advice. CRDF tools are illustrative; examples are composites drawn from public data. Do your own due diligence and consult qualified professionals.
I run this analysis on specific deals. If you hold Texas assets on a ten-year horizon and your model treats water, ground, and heat as flat lines, book 20 minutes.
Jamie Wolf, MBA — Founder & Publisher, Climate-Ready Real Estate Investing, © 2026, CR REI Holdings LLC