

Signals: S10 Migration & Demographic Shift · S12 Resilience Economics & Retrofit · S9 Zoning, Codes & Land Use
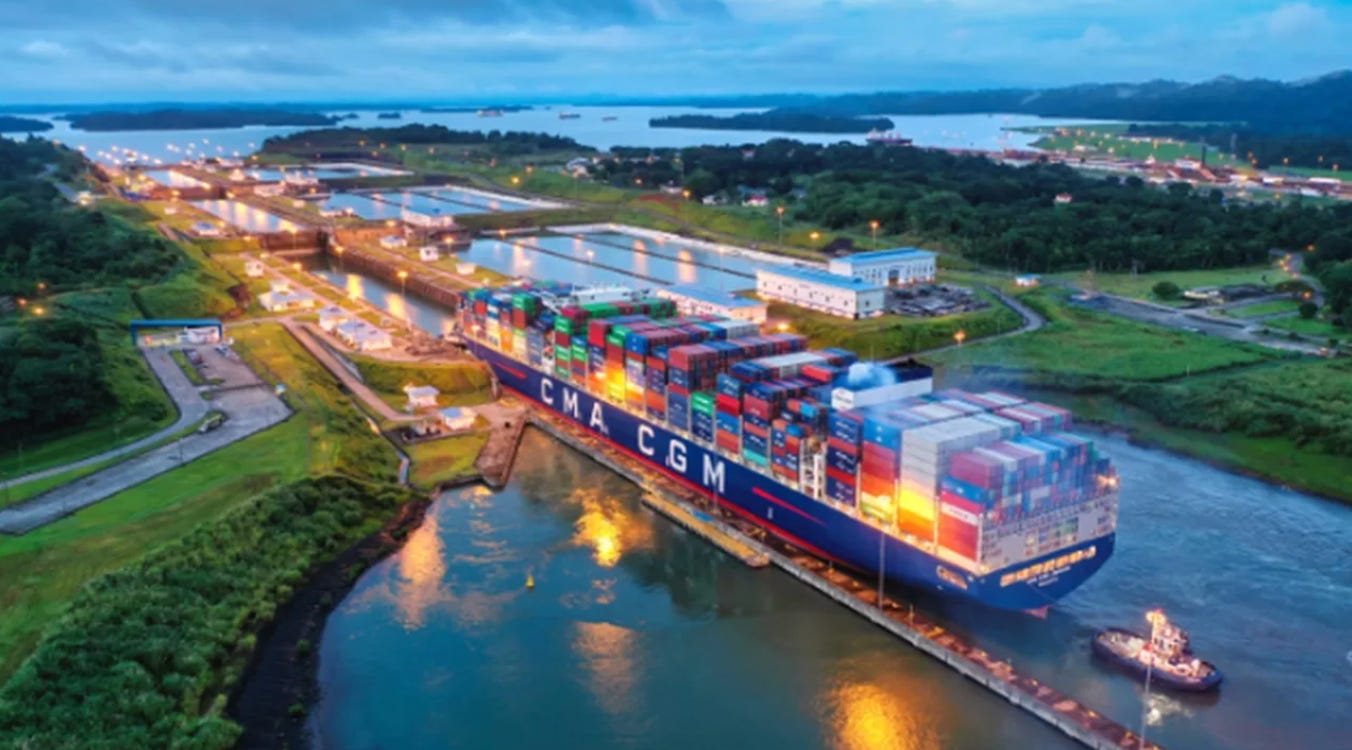
Photo credit: Autocontrol del Canal de Panamá
Construction input prices rose 8.0% through May 2026, the fastest twelve-month increase since the pandemic. Demand did not do that.
Aluminum mill shapes were up 33.0% year over year in January 2026 and steel mill products 20.7%, while project starts were flat and the labor gap was shrinking.
When the cost line stops tracking demand and starts tracking tariff schedules, canal drafts, and freight reroutes, the materials line stops behaving like a market price and starts behaving like a tax. It does not ease when your leasing slows.
Market Signal
The Bureau of Labor Statistics index for net inputs to construction rose 3.5% across calendar 2025. That is a normal year. It then rose 8.0% in the twelve months to May 2026, with 1.7% in May alone. The Associated General Contractors of America, reading the same series, called it the largest year-over-year jump since the pandemic.
So this is not a slow grind that has been running since 2021. It is a step change that landed in the first half of 2026, and it landed while demand was soft.
The proximate cause is documented and dated. Presidential Proclamation 10947, signed June 3, 2025, raised the Section 232 tariff on steel and aluminum imports from 25% to 50%, effective 12:01 a.m. on June 4, 2025. The 25% rate had itself been set only in February of that year.
A tariff on an intermediate good behaves differently from a demand shock. It sets a floor. Demand can fall, and the floor stays where it is, which is why the index kept climbing through a period when nobody was describing the market as hot.
A second force is underneath, and it is the one these briefs have tracked all year. The Panama Canal cut transits by 21% in fiscal 2024, to 9,944 from 12,638, as drought forced water conservation. The Canal Authority reduced daily slots from a normal 36 to 22 at the trough in late 2023, restoring 24 from mid-January 2024.
That was not a one-time event. On August 5, 2026, the Canal Authority set a maximum authorized Neopanamax draft of 48.0 feet, with 47.5 feet to follow, “aimed at ensuring the long-term sustainability of its operations” while its specialists assess “the potential impacts of the El Niño phenomenon.” On August 20, it went further, cutting daily slots at the Neopanamax Locks to nine from September 3 and at the Panamax Locks to 25, then 23 from September 15, and moved the draft dates to September 2 and October 1.
The National Oceanic and Atmospheric Administration’s Climate Prediction Center puts a number on that phenomenon. As of August 13, 2026, it carries an El Niño Advisory, with a greater than 90% chance of a very strong event over the coming fall and winter and a 69% chance of an event in October through December exceeding any since 1950.
A draft restriction is a capacity restriction. A ship that cannot load to its marks either carries less or goes around, and both show up in your landed cost and your lead time.
Case Study
Australia ran the experiment that shows what happens when a builder absorbs all of this on a fixed price. The results are on the public record, and worth reading closely.
The Australian Bureau of Statistics measured input prices to house construction rising 17.3% in the twelve months to the June quarter of 2022. Output prices, what builders charge, rose 40.8% between the September quarter of 2020 and the June quarter of 2024.
Note that those two indices measure different things. The first is what a builder pays. The second is what a builder can charge. The gap between them, and the lag, is where the damage happens.
In calendar 2024, 3,217 Australian construction firms entered external administration, up from 2,546 the year before, a rise of roughly 26%. On the financial-year series, the Australian Securities and Investments Commission reports construction insolvencies climbing from 2,213 in 2022-23 to 2,977 in 2023-24 to 3,596 in 2024-25.
Housing demand was strong throughout. The homes were selling. What failed was the procurement structure.
Australian residential builders sign fixed-price contracts because the law and the lenders require it. Under section 13 of Victoria’s Domestic Building Contracts Act 1995, a builder may not enter a cost-plus contract unless the work falls in a class the regulations permit or “the work to be carried out under the contract involves the renovation, restoration or refurbishment of an existing building and it is not possible to calculate the cost of a substantial part of the work without carrying out some domestic building work.”
The permitted class is defined by value. Regulation 10 of the Domestic Building Contracts Regulations 2017 permits cost-plus only where a contract, entered into on or after August 1, 2017, “is reasonably estimated will cost $1 000 000 or more.”
So the prohibition bites hardest exactly where it was meant to protect: the standard new residential build under a million dollars. A consumer-protection rule written to stop mid-build price gouging became the mechanism that transferred the whole supply-chain risk to the party least able to hedge it.
ASIC’s own series, published Jul 13, 2026, shows construction external administrations falling to 3,435 in 2025-26 from 3,596 the year before. That is the first annual decline in five years.
The structural lesson survives that reversal, and it is the only part that travels. More than five thousand builders failed across two years in a market where demand never weakened, because the contract structure, not the market, held the risk. A cycle turning does not undo it. It just means the next shock will find the same architecture waiting.
The transferable point for a US or European operator is not “avoid fixed-price contracts.” It is that the contract structure is itself an underwritten position, and in most pro formas it is invisible, buried inside the unstated assumption that the builder will absorb whatever the supply chain does.
Strategic Implications
Underwrite the procurement structure as a line item. Before you sign, ask who holds the escalation risk and what happens if they cannot. A low bid from a builder who then fails is more expensive than a high bid from one who does not, because you pay the second builder, you pay the carrying cost of the delay, and you pay interest through both.
Read the tariff as a floor, not a spike. The 50% Section 232 rate is a policy setting, and the January 2026 metals numbers, aluminum at 33.0% and steel at 20.7%, are what it produced with demand flat. A model that assumes materials revert when leasing slows is modeling the wrong mechanism.
Price delivery certainty, not just unit cost. A material that is cheaper per ton and arrives weeks late has a cost, and it lands in your interest reserve. Regional sourcing and substitution are now a schedule hedge, which is a different argument from the sustainability one and a stronger one at a credit committee.
Watch the labor number in the right direction. Associated Builders and Contractors estimated the industry needed 439,000 net new workers in 2025 and 349,000 in 2026. That modeled figure comes from the association’s own construction-spending forecast, and it is falling. A shrinking worker gap in a market with rising input costs is not good news. It is a demand signal, and it says the cost pressure is coming from the supply side.
Do not build a resilience case on a green premium above 10%. Certified-building rent premiums that control for age, size, renovation history, and location cluster at 3% to 8%. CBRE’s own study is the cleanest demonstration: LEED-certified buildings’ asking rents run 31% above non-certified peers raw, and 3.7% after controls. The uncontrolled number measures the fact that certified buildings are newer and better located.
Future Signal
The shift worth watching is that supply-chain localization stops being a sustainability story and becomes a delivery-certainty story priced into the schedule.
Mass timber, low-carbon concrete and regional sourcing will be valued less on sticker price and more on whether the material arrives when a canal is throttled or a tariff lands. That is a procurement argument, and procurement arguments reach a credit committee faster than carbon arguments do.
Watch Signal 9, because code is where it gets locked in. When building codes begin to reward or require resilient and lower-carbon materials, today’s premium product becomes tomorrow’s baseline, and the supplier who already controls a compliant regional material is not selling an upgrade. They are selling the only thing you can specify.
The counter-signal is worth holding, too. Federal procurement in the United States moved the other way in 2025: the General Services Administration’s low-embodied-carbon program had obligated $767 million of $2.15 billion when disbursements were frozen in February 2025, and Congress repealed the authorizing section and rescinded the unobligated balance that July. Codes and procurement do not move in one direction, and a thesis that assumes they do will be wrong in at least one jurisdiction.
The physical constraint doesn’t reverse. A canal with less water in it carries less cargo, whatever the policy environment is doing.
As always, KNOW YOUR SIGNALS and BE CLIMATE READY!
Jamie
Run this on your own deal
The CRDF Signal Tracker™ built for this brief lets you log the materials, labor, and code signals in your own markets against your own procurement structure, translate them into financial impact, and score which ones are actually moving your basis. Free, no signup: Brief_25_CRDF Signal Tracker™ (xlsx)
New to the framework? The blank master CRDF Signal Tracker™ and Deal Stress Test™ workbooks are at climatereadyre.com/tools.
Related briefs
Same signal (S12 Resilience Economics & Retrofit):
Brief 21 · Resilience-Weighted Portfolio Construction for Pensions: Tokyo’s 2.6%
Brief 3 · Hoboken Property Values: The Impact of $230M Post-Sandy Flood Infrastructure
Next in sequence:
Brief 26 · The True Cost of a FORTIFIED Roof: Insurance Savings & Storm Resilience - coming soon
Sources
Every figure above, with the date the data covers, the date it was published, and the date I verified it.
Construction input prices — the BLS index for net inputs to construction rose 3.5% across calendar 2025 and 8.0% in the twelve months to May 2026, with 1.7% in May alone
US Bureau of Labor Statistics, Producer Price Index series WPUIP230000 · Data as of May 2026 · Published Aug 13, 2026 · Accessed Aug 2026
The Associated General Contractors of America, which publishes the same series for nonresidential construction, reports 3.3% for calendar 2025 and 8.4% through May 2026, calling it the largest year-over-year jump since the pandemic.
Metals — aluminum mill shapes up 33.0% and steel mill products up 20.7% year over year in January 2026
Associated General Contractors of America, producer price index analysis · Data as of Jan 2026 · Published Feb 27, 2026 · Accessed Aug 2026
Copper and brass mill shapes rose 15.7% over the same twelve months, reaching 26.8% only through May 2026. These three figures are not from the same month.
Section 232 tariff — raised from 25% to 50% ad valorem on steel and aluminum, effective June 4, 2025
Proclamation 10947, Adjusting Imports of Aluminum and Steel Into the United States, 90 FR 24199 · Data as of Jun 3, 2025 · Published Jun 9, 2025 · Accessed Aug 2026
Panama Canal transits — 9,944 in fiscal 2024, a 21% reduction from fiscal 2023; daily slots fell from a normal 36 to 22 at the trough and returned to 24 from mid-January 2024
Autoridad del Canal de Panamá, financial results for FY24 · Data as of fiscal year 2024 · Published Oct 25, 2024 · Accessed Aug 2026
A 29% figure circulates widely, and the Canal Authority did not publish it. The two transit counts do not support it.
Current draft restriction — maximum authorized Neopanamax draft of 48.0 feet from September 2, 2026, falling to 47.5 feet on October 1, 2026, after the Canal Authority’s August 20, 2026 advisory postponed both dates and cut daily slots to nine at the Neopanamax Locks and 25, then 23, at the Panamax Locks
Autoridad del Canal de Panamá, new draft adjustments for the Neopanamax Locks · Data as of Aug 2026 · Published Aug 5, 2026 · Accessed Aug 2026
El Niño forecast — a greater than 90% chance of a very strong event in the 2026-27 Northern Hemisphere fall and winter, and a 69% chance of an October to December event exceeding any since 1950
NOAA Climate Prediction Center, ENSO Diagnostic Discussion · Data as of Jul 2026 · Published Aug 13, 2026 · Accessed Aug 2026
A probability against a 1950 baseline at a stated index threshold, not a forecast of fact. Revised monthly.
Australian construction insolvencies — 3,217 firms in calendar 2024 against 2,546 the year before; on the financial-year series 2,213 in 2022-23, 2,977 in 2023-24, 3,596 in 2024-25 and 3,435 in 2025-26
Australian Securities and Investments Commission, insolvency statistics Series 1 · Data as of 2021-22 to 2025-26 · Published Jul 13, 2026 · Accessed Aug 2026
The calendar-year and financial-year counts are different series and overlap by six months. The 2025-26 figure is the first annual decline in five years.
Australian construction prices — input prices to house construction up 17.3% in the twelve months to the June quarter 2022; output prices for house construction up 40.8% from the September quarter 2020 to the June quarter 2024
Australian Bureau of Statistics, Producer Price Indexes · Data as of Jun quarter 2024 · Published Aug 2, 2024 · Accessed Aug 2026
Input and output are different indices. One is what a builder pays, and the other is what a builder charges.
Victoria’s cost-plus restriction — a builder may not enter a cost-plus contract for standard residential work; the permitted class is contracts reasonably estimated at $1,000,000 or more
Domestic Building Contracts Act 1995 (Vic) section 13 and Domestic Building Contracts Regulations 2017 (Vic) regulation 10 · Data as of 2017 · Published 2017 · Accessed Aug 2026
The second gateway is narrower than complexity. It covers renovation, restoration, or refurbishment where part of the cost cannot be calculated without first doing some work first.
Construction labor gap — an estimated 439,000 net new workers needed in 2025 and 349,000 in 2026
Associated Builders and Contractors, 2026 workforce estimate · Data as of 2026 · Published Jan 15, 2026 · Accessed Sep 2026
Modeled by a trade association from its own construction-spending forecast at roughly 3,450 jobs per $1 billion. A projection, not a count, and the series is falling.
Certified-building rent premium, controlled — roughly 3% to 8% once age, size, renovation history and location are held constant; LEED asking rents run 31% above non-certified peers before those controls and 3.7% after
CBRE, Green Is Good and Eichholtz, Kok and Quigley, American Economic Review · Data as of 2007 to 2022 · Published 2010 and October 26, 2022 · Accessed Aug 2026
Controlled. CBRE regressed on age, size, amenities, renovation history, and location across roughly 2,800 LEED and 17,700 non-LEED US office buildings. Figures above 10% are uncontrolled asking-rent spreads.
Federal low-embodied-carbon procurement — $2.15 billion appropriated, of which $2.003 billion was allocated across 154 projects in November 2023; $767 million obligated by January 31, 2025; disbursements frozen February 13, 2025, and the authorizing section repealed with unobligated balances rescinded in July 2025
US Government Accountability Office, GAO-25-107349 and GSA low-embodied-carbon projects fact sheet · Data as of Jan 31, 2025 · Published Nov 3, 2023 and April 29, 2025 · Accessed Aug 2026
Commentary and analysis only. Not investment, financial, legal, tax, or professional advice. CRDF tools are illustrative; examples are composites drawn from public data. Do your own due diligence and consult qualified professionals.
I run this analysis on specific deals. If you are pricing a build where the escalation risk sits with a builder you have not stress-tested, book 20 minutes.
Jamie Wolf, MBA — Founder & Publisher, Climate-Ready Real Estate Investing, © 2026, CR REI Holdings LLC