

Signals: S5 Acute Climate Hazard · S2 Credit & Mortgage Markets · S1 Insurance Repricing
Canada’s bank regulator ran flood maps across the country’s lenders and published its findings. Over 250 institutions took part, covering CA$904 billion in mortgage and real estate assets and CA$3 trillion in insured property values, about 40 percent of the mortgages in Canada.
Only 12 percent of deposit-taking institutions require or collect information on flood insurance coverage for the properties they lend against. That is the single most useful sentence in the report for a borrower.
It means the file your lender is missing is one you can hand it, before the credit committee prices the gap as unknown.
Market Signal
In September 2025, OSFI, Canada’s bank regulator, and Quebec’s regulator, the AMF, published the results of a standardized climate scenario exercise. The flood module covered eleven urban regions from Vancouver to Fredericton. Toronto was not one of them.
Two findings matter to a borrower. The first is the collection gap: 12 percent of deposit-taking institutions require or collect flood insurance information on the properties they lend against, in a country where only 40 percent of homeowners buy optional flood cover. The second is concentration. Between 10 and 12 percent of in-scope exposures sit in high-risk flood areas, and OSFI projects commercial exposures to stay more concentrated in those zones than residential ones.
Fire is the secondary hazard. OSFI projects the share of lenders’ exposures in high or very-high wildfire zones rising from 16 percent today to 29 percent by 2050.
The regulator also said what comes next. Future work will focus on whether institutions can measure and adequately price catastrophic and climate risk. OSFI’s climate guideline, B-15, is in force now, and it names the channel this brief is about. Physical risk means higher loan-to-value and loss given default because collateral values decline.
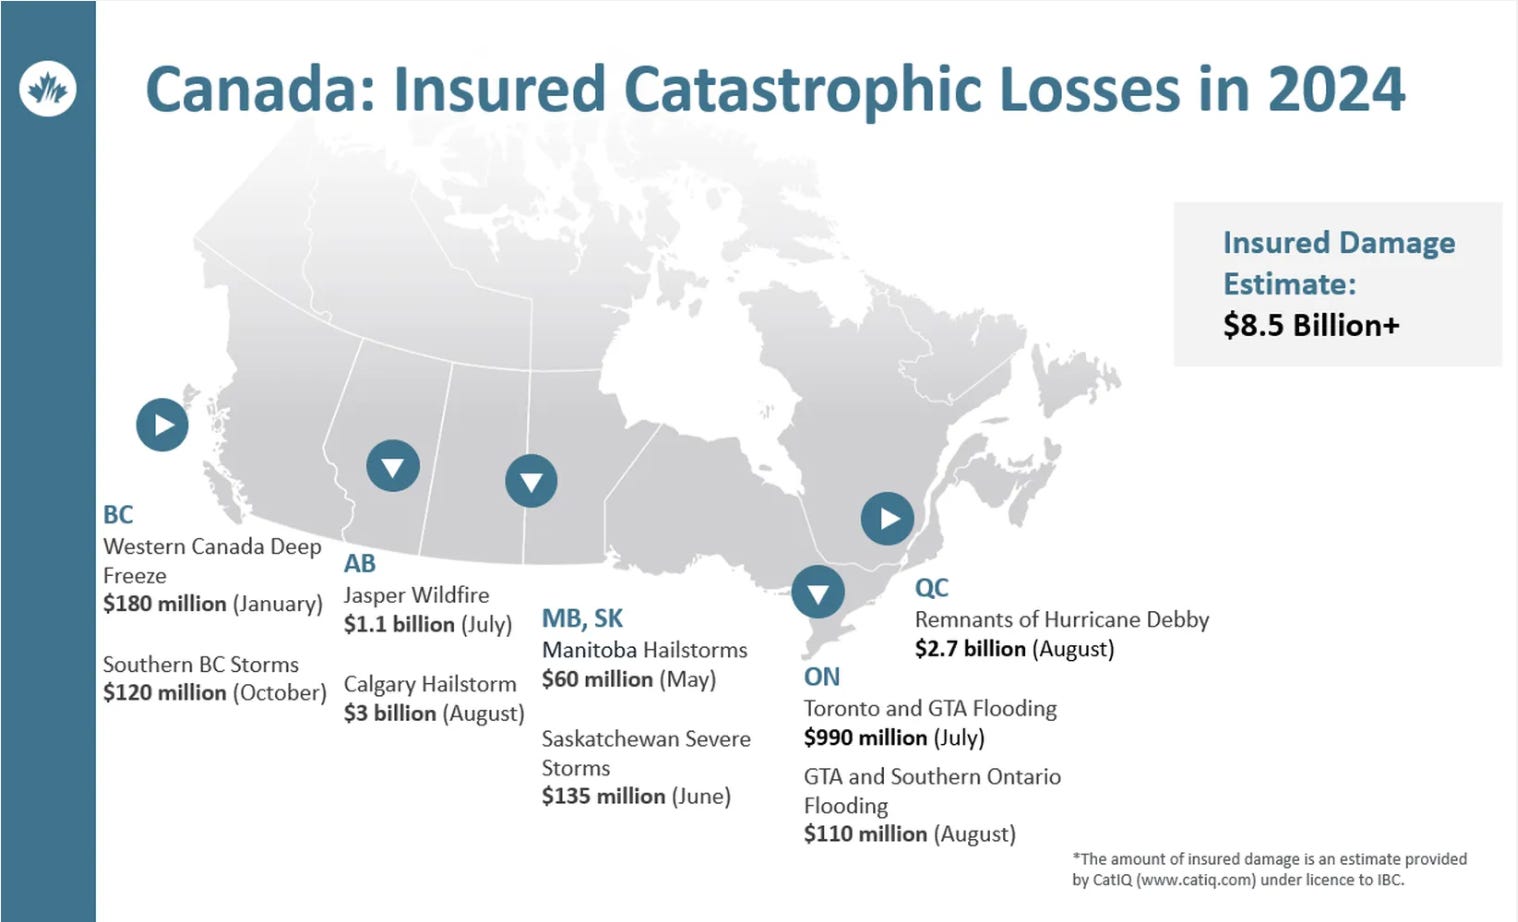
The losses are already moving collateral values. Insured severe-weather damage in Canada reached CA$8.55 billion in 2024, the first year above CA$8 billion. The remnants of Hurricane Debby flooded Quebec for about CA$2.7 billion of that, and flash floods in the Toronto area added about CA$990 million.
This is Signal 5, acute climate hazard, flowing into Signal 2, credit and mortgage markets, through Signal 1, insurance.
Deal Scenario
This is a modeled scenario, which means the numbers are not pulled from an actual deal.
A 60-unit older rental building in Vancouver, financed on CMHC-insured terms. Rent is CA$2,100 per unit per month, assumed at about 89 percent of CMHC’s October 2025 average for a purpose-built two-bedroom in Vancouver, which was CA$2,363. Vacancy is 3.7 percent, CMHC’s Vancouver figure. Operating costs are 38 percent of income, including insurance at 5 percent. That 5 percent is a U.S. benchmark from the Federal Reserve, used because no public Canadian series exists for apartment insurance; Canada’s multifamily commercial market runs on private data, broker reports, and specialized corporate tracking indices.
The loan is sized at CMHC’s minimum coverage of 1.20 on a ten-year term, with 40-year amortization and Canadian semi-annual compounding. The interest rate is 4.58 percent, an indicative ten-year CMHC-insured rate from Colliers, about 0.71 points over the Government of Canada ten-year bond. The cap rate is 4.25 percent, the middle of CBRE’s Vancouver range for older low-rise buildings.
On those inputs, net operating income is about CA$902,755, and the building supports a loan of about CA$13.9 million.
Now the renewal. Canadian commercial property insurance is getting cheaper right now. Marsh reports Canadian property rates down 8 percent in the second quarter of 2026, the ninth quarterly decline in a row, and Applied Systems puts real estate property renewals up just 1.02 percent in the first quarter. So a 50 percent jump is not the market. It is what happens to one building when its insurer identifies it as sitting in a high-risk flood zone at renewal. That is the stress being tested here.
Insurance up 25 percent. The loan this building supports falls by about CA$280,000.
Insurance up 50 percent. It falls by about CA$559,000. Net operating income drops 4 percent, and the loan drops 4 percent.
Insurance up 100 percent. It falls by about CA$1.12 million.
Same building, same rent, same tenants. Then put the ladder next to the rate. If the ten-year rate rises half a point, to 5.08 percent, this building loses about CA$920,000 of loan capacity, more than the 50 percent insurance shock. Climate is one input. The rate is the one that gets you.
Underwriting Analysis
Five tests to run before your lender runs them. They are not all Canadian, and they are still valid data points for evaluating a deal or a portfolio at renewal.
First, know which test binds. The title of this brief names DSCR and LTV, and in this modeled scenario only one of them bites. The coverage ratio sets the loan. The loan sits at about 65 percent of value, well under CMHC’s 85 percent ceiling, before and after the shock. That 85 percent limit would only bind above a cap rate of about 5.53 percent, or if a lender cut the building’s value by more than about 23 percent for flood risk. Under insured terms in Vancouver, rising climate costs cut net income, which drops the deal below its permitted covenant ratio, and that is what costs loan proceeds.
Loan-to-value comes into play only with a large collateral haircut. How large can that get? A Bank for International Settlements working paper modeled a loan secured on commercial property in Mobile, Alabama. With a 3 percent annual chance of a major hurricane, the property lost 16 percent of its value, and loss given default rose from 10 percent to 24.8 percent. Even 16 percent stays under this building’s 23 percent threshold. That is an illustration from a working paper, not observed data, and it is a U.S. hurricane case.
Second, find out whose hazard map the lender uses, because the maps disagree. A study for the U.K.’s Climate Financial Risk Forum, written by Jo Paisley and Maxine Nelson at the GARP Risk Institute, compared 13 physical-risk vendors on the same 100 properties. For a one-in-200-year flood, the correlation between the damage estimates of eight of those vendors ran from 0.2 to 0.9. In one geocoding test, a vendor placed a property 1,507 kilometers from the median of the other vendors’ locations. Four vendors gave clients no measure of uncertainty. Which vendor your lender bought is a material fact about your loan.
Third, put insurance inside the coverage ratio, not in a footnote. The Federal Reserve estimates that in U.S. apartment buildings, a dollar increase in insurance costs cuts owners’ net income by about 72 cents. That is U.S. data, and Canada’s rent rules leave even less room to pass costs through. Your lender sizes the loan on the income that remains after that cost.
Fourth, expect the lender to act on the map, not just the price. Since February 2024, Desjardins, the largest mortgage provider in Quebec, has halted financing for property purchases inside the province’s highest-risk floodplains, even though that represents less than 5 percent of its mortgages, per La Presse. National Bank told La Presse it decides flood-zone loans case by case, including whether the property can be insured, how resilient the construction is, and the borrower’s financial strength.
The terms move, not only the price. From January 2026, European regulators expect banks to consider adjusting loan terms, tenor, and pricing based on a borrower’s ESG and climate criteria. Singapore introduced something similar in 2020, allowing banks to consider environmental covenants and to price the risk. In other words, a lender looking at a hazard-exposed property can charge more, shorten the term, or write conditions into the contract.
Fifth, hand the lender the file it does not have. Only 12 percent of lenders collect flood insurance data on their collateral. National Bank is already asking. Its 2025 sustainability report says it sends a climate questionnaire to corporate and commercial real estate borrowers, asking what percentage of their assets sit in regions vulnerable to extreme weather, and it discusses the answers at least once a year, at origination, review, and renewal. In its own table, residential mortgages, a quarter of its loan book, rate Moderate for physical risk. National Bank also says it is integrating an outside climate data solution, without yet saying whose.
So bring a hazard report, the flood coverage you have in force, and any mitigation you have done. Answer the question before it gets priced as an unknown.
Strategic Implications
Watch where the data is going, because it is arriving on the underwriting side first.
The insurers moved first. In September 2025, Revau, a Canadian agency writing commercial lines, announced it is building the flood and wildfire models of Geosapiens, a Quebec City climate-risk modeling company led by co-founder and CEO Hachem Agili, into its underwriting platform. Revau promises more accurate underwriting from locally calibrated, building-level data.
Then the carriers. In December 2025, Co-operators announced a long-term flood partnership with Geosapiens to sharpen risk assessment at the property and portfolio level, citing B-15. Co-operators says it has been an investor since the company’s first round.
And the regulator. OSFI’s flood maps for the scenario exercise came from Riskthinking.AI in Toronto, founded by Ron Dembo. MSCI now owns First Street, the U.S. modeler.
The caveat. Revau and Co-operators are insurers, not lenders, and neither release says whether the partnership covers commercial buildings or residential property. They show where pricing is heading, not where it has arrived.
What this means is that the same data now sits on both sides of the table. A borrower who buys the data before applying can dispute a bad score, show the mitigation, and argue for loan proceeds instead of accepting a blanket discount. A borrower who does not will be underwritten on somebody else’s map.
So underwrite yourself first. Before you refinance, run your coverage ratio at your insurance cost plus 25, 50, and 100 percent, and at a rate half a point higher. Get a hazard report and a flood insurance quote into the file. And ask your lender which vendor’s map it uses.
As always, KNOW YOUR SIGNALS and BE CLIMATE READY!
Jamie
Run this on your own deal
The CRDF Deal Stress Test™ built for this brief lets you run your own building through the insurance ladder, the rate move, and a collateral reduction, with every input flagged so you can replace it with your own numbers. Free, no signup: Brief 38_CRDF Deal Stress TestTM (xlsx)
New to the framework? The blank master CRDF Signal Tracker™ and Deal Stress Test™ workbooks are at climatereadyre.com/tools.
Related briefs
Same signal (S5 Acute Climate Hazard):
Brief 34 · Real Estate Climate Risk: Acute vs. Chronic Threats
Brief 11 · Hurricane Helene Aftermath: Western North Carolina Home Insurance Rates Rose 4.4%
Next in sequence:
Brief 39 · Johor Data Centers: How Tier Bans and Water Limits Impact Investors - coming soon
Sources
Every figure above includes the data coverage date, the publication date, and the date I verified it.
The regulator’s flood and wildfire findings — the OSFI and AMF standardized climate scenario exercise, covering over 250 institutions, CA$904 billion in mortgage and real estate assets and CA$3 trillion in insured property values, about 40 percent of Canada’s mortgages; 12 percent of deposit-taking institutions require or collect flood insurance information on collateral; 40 percent of homeowners buy optional flood insurance; 10 to 12 percent of in-scope exposures sit in high-risk flood areas, with commercial more concentrated than residential; wildfire exposure in high or very-high zones rising from 16 percent to 29 percent by 2050.
OSFI, Strengthening Climate Risk Financial Resilience: Insights from the Standardized Climate Scenario Exercise · Data as of SCSE 2024, 2050 conditions · Published Sep 11, 2025 · Accessed Sep 2026
The exercise covered eleven urban regions and excluded Toronto. The wildfire and flood shares are projections under the exercise’s scenarios, not observed portfolio losses.
The supervisory channel — Guideline B-15 names physical risk raising loan-to-value and loss given default through reduced collateral value. In force.
OSFI, Guideline B-15, Climate Risk Management · Data as of in force 2025 to 2026 · Published Mar 7, 2025 · Accessed Sep 2026
The guideline states the transmission channel qualitatively in its annex. It sets no loan-to-value or loss-given-default figure.
The loss backdrop — Canadian insured severe-weather losses of CA$8.55 billion in 2024, the first year above CA$8 billion, including about CA$2.7 billion from the remnants of Hurricane Debby in Quebec and about CA$990 million from Toronto-area flash floods.
Insurance Bureau of Canada, using CatIQ data · Data as of 2024 · Published Jan 13, 2025 · Accessed Sep 2026
Insured losses only. Uninsured and public-infrastructure damage are not included in the total, and the largest single 2024 event was Calgary hail, not flood.
The deal scenario — 60 units in Vancouver at CA$2,100 per unit per month, 3.7 percent vacancy, operating costs 38 percent of income with insurance at 5 percent, CMHC terms of 1.20 coverage, 85 percent maximum loan-to-value and 40-year amortization, a 4.58 percent ten-year rate on Canadian semi-annual compounding and a 4.25 percent cap rate; net operating income about CA$902,755 supporting about CA$13.9 million of loan; insurance shocks of 25, 50 and 100 percent cutting loan capacity by about CA$280,000, CA$559,000 and CA$1.12 million; loan-to-value 65 percent before and after, binding only above a 5.53 percent cap rate or a collateral haircut above 23 percent; a 50 basis point rate rise costing about CA$920,000.
CRREI modeled scenario · Method: a single insurance renewal applied to one building’s coverage ratio, holding rent, vacancy, and every other operating line constant, so the loan effect is attributable to the insurance line alone · Modeled — not a specific asset
The rent is an assumption set at about 89 percent of CMHC’s October 2025 Vancouver two-bedroom average of CA$2,363, and the 5 percent insurance share is a U.S. Federal Reserve benchmark because no public Canadian apartment insurance series exists. The 50 percent shock is not the Canadian market; it is a single-building repricing case.
The financing and valuation inputs — CMHC standard rental terms of 1.20 minimum coverage on a ten-year term, 85 percent maximum loan-to-value and 40-year amortization; CMHC’s Vancouver purpose-built two-bedroom average rent of CA$2,363 per month and 3.7 percent vacancy; CBRE’s Vancouver low-rise class B cap rate range, and an indicative ten-year CMHC-insured rate of about 4.58 percent, about 0.71 points over the Government of Canada ten-year bond.
CMHC, Mortgage Loan Insurance for Standard Rental Housing and Rental Market Report Fall 2025; CBRE, Canadian Cap Rates Q2 2026; Colliers, OnMultifamily Bond Yield Tracker · Data as of Oct 2025 to Sep 2026 · Published Dec 11, 2025 · Accessed Sep 2026
The Colliers rate is a broker indication, not a published series, and the spread over the Government of Canada ten-year is not drawn from an official series.
The insurance market backdrop: Canadian commercial property insurance rates fell 8 percent in the second quarter of 2026, a ninth consecutive quarterly decline, while Canadian real estate property renewal premiums rose 1.02 percent in the first quarter of 2026.
Marsh, Global Insurance Market Index (Canada); Applied Systems, Applied Commercial Index Q1 2026 · Data as of Q1 to Q2 2026 · Published Jul 29, 2026 · Accessed Sep 2026
Both are market averages across portfolios. Neither describes what happens to a single building that an insurer re-rates into a high-risk flood zone at renewal.
The insurance pass-through — a dollar increase in insurance costs cuts U.S. apartment owners’ net income by about 72 cents, with insurance running about 5 percent of revenues.
Hughes and Molloy, FEDS Notes, Federal Reserve Board · Data as of 2000 to 2024 panel · Published Sep 19, 2025 · Accessed Sep 2026
U.S. data on U.S. apartment buildings. It is used here as a benchmark, not as a measurement of Canadian pass-through, and Canadian rent rules differ.
The vendor disagreement — 13 physical-risk vendors compared on the same 100 properties; for a one-in-200-year flood, correlation between eight vendors’ damage estimates ran from 0.2 to 0.9; one vendor placed a property 1,507 kilometers from the median of the others; four vendors supplied no measure of uncertainty.
Paisley and Nelson, GARP Risk Institute for the Climate Financial Risk Forum · Data as of 2025 exercise · Published Oct 2025 · Accessed Sep 2026
A benchmarking exercise on a sample portfolio, not an audit of any vendor’s Canadian flood product.
The collateral haircut case — a modeled loan on commercial property in Mobile, Alabama: a 3 percent annual chance of a major hurricane cut value 16 percent and raised loss given default from 10 percent to 24.8 percent.
Pozdyshev, Lobanov and Ilinsky, BIS Working Paper 1274 · Data as of illustrative, 2025 probabilities · Published Jul 7, 2025 · Accessed Sep 2026
An illustration inside a working paper, not observed data, and a U.S. hurricane case rather than a Canadian flood one.
Lenders acting on the map — Desjardins halted financing for purchases in Quebec’s highest-risk floodplains from February 2024, affecting under 5 percent of its mortgages; National Bank decides flood-zone loans case by case, sends a climate questionnaire to corporate and commercial real estate borrowers, reviews the answers at origination, review and renewal, rates residential mortgages, a quarter of its loan book, Moderate for physical risk, and is integrating an unnamed external climate data solution.
La Presse (Charles Lecavalier); National Bank of Canada, 2025 Sustainability Report · Data as of Feb 2024; fiscal 2025 · Published Feb 21, 2024; report published fiscal 2025 (PDF Mar 9, 2026) · Accessed Sep 2026
The Desjardins policy covers purchase financing in the 0-to-20-year flood zone, except for a 35 percent down payment on a flood-proofed property. National Bank’s questionnaire is disclosed in its own report, and it does not name the vendor.
The supervisory terms channel outside Canada — European banks expected to consider adjusting loan terms, tenor, and pricing on ESG criteria from January 2026, and Singapore banks permitted to consider environmental covenants and to price the risk since 2020.
European Banking Authority, EBA/GL/2025/01; Monetary Authority of Singapore, Guidelines on Environmental Risk Management for Banks · Data as of Jan 11, 2026 · Published Jan 8, 2025 · Accessed Sep 2026
Guidelines, not statute, and neither applies to a Canadian lender. The Singapore guidance dates from December 2020 and is a baseline, included to show the direction of travel.
The data arriving on the underwriting side — Revau integrating Geosapiens’ flood and wildfire models into its underwriting platform; Co-operators signing a long-term flood partnership with Geosapiens and disclosing it has invested since the company’s first round; Riskthinking.AI of Toronto supplying the flood data for the OSFI exercise; MSCI completing its acquisition of First Street.
Revau; Co-operators; Riskthinking.AI; MSCI Inc. · Data as of Sep 2025 to Aug 2026 · Published Dec 4, 2025; MSCI Aug 3, 2026 · Accessed Sep 2026
Revau and Co-operators are insurers, not lenders, and neither release states whether the models are applied to commercial buildings or residential property. No volumes or deal terms were disclosed.
Commentary and analysis only. Not investment, financial, legal, tax, or professional advice. CRDF tools are illustrative; examples are composites drawn from public data. Do your own due diligence and consult qualified professionals.
I run this analysis on specific deals if you are refinancing a building that an insurer has just re-rated; book 20 minutes.
Jamie Wolf, MBA — Founder & Publisher, Climate-Ready Real Estate Investing, © 2026, CR REI Holdings LLC