

Signals: S3 Capital Allocation Flows · S12 Resilience Economics & Retrofit · S2 Credit & Mortgage Markets
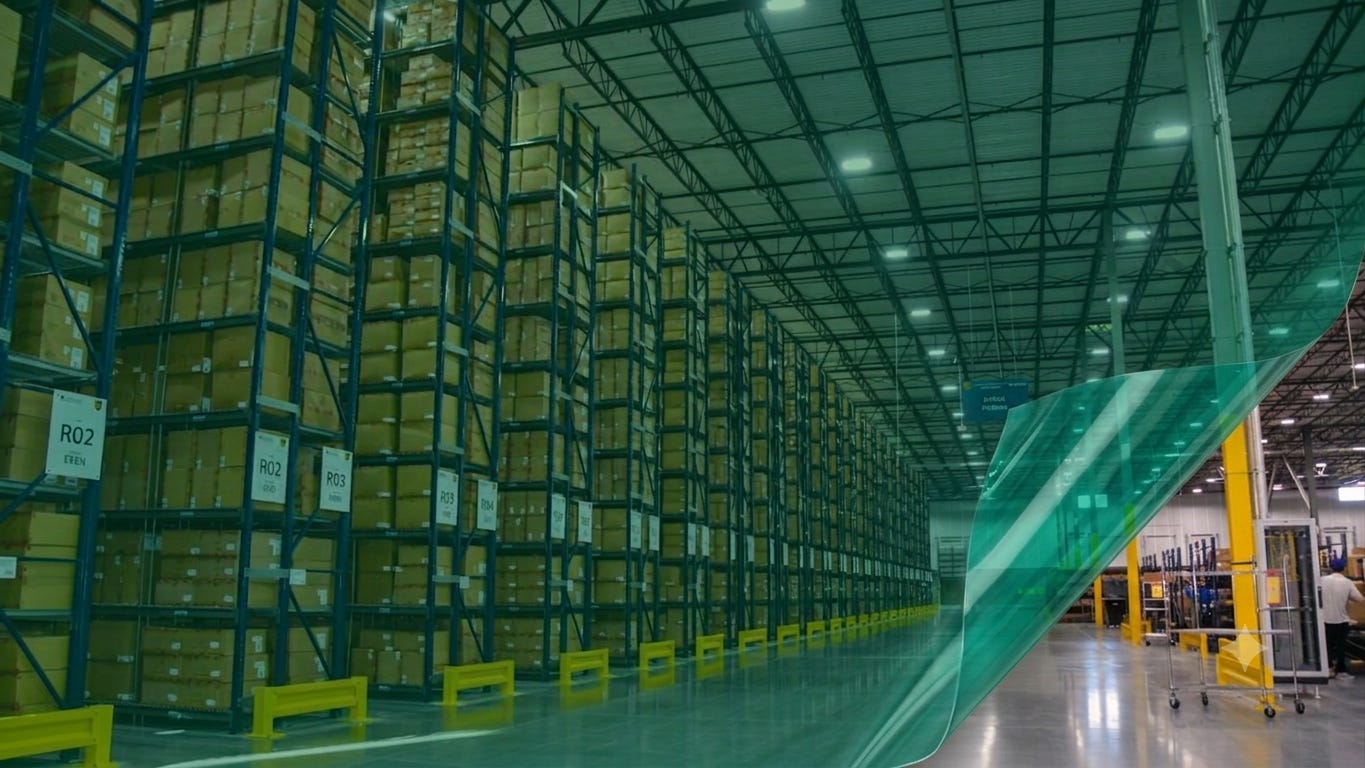
Brookfield closed its second Global Transition Fund at $20 billion, bringing total assets to $23.5 billion, including roughly $3.5 billion in co-investments.
According to Brookfield, that is the world’s largest private fund dedicated to the clean-energy transition.
The interesting part is not the size. It is what a fund that large has to buy, and what that tells a mid-market sponsor about who will be bidding at their exit.
Market Signal
A fund of this scale has a deployment problem before it has an investment problem.
$23.5 billion cannot be placed in small increments. It requires large assets in liquid jurisdictions and in sectors where the fund can repeatedly write institutional-size checks. That constraint shapes the strategy more than any thematic view does.
As a result, transition capital at scale flows toward infrastructure-like real assets. Data centers, logistics, grid-adjacent industrial, or large-format retrofit programs. In other words, assets with long duration, contracted or quasi-contracted income, and a physical footprint that can absorb capital.
Meanwhile, the allocator layer above it has kept its requirements. GRESB’s 2025 real estate benchmark covers 1,002 managers, and 81.5% of participants now hold formal net-zero policies, up from 78.8% in 2024 and 72.4% in 2023.
Industry reporting suggests more than half of the capital raised by the twenty largest private equity real estate firms in recent vintages carried a formal climate strategy. That is a trade-press estimate rather than a published dataset, but it reflects a trend.
The debt market has moved too, though not as far as the marketing suggests, and most commentary overstates the case.
Green, social, sustainability and sustainability-linked debt aligned with Climate Bonds’ methodology reached USD 1.1 trillion in 2024. But the pricing advantage attached to that label is small. The sovereign and quasi-sovereign greenium runs about 2 basis points in advanced economies against roughly 13 basis points in emerging markets, measured across 332 matched bond pairs from 2014 to 2023. A separate IFC and Amundi series, measured across the broader green bond market rather than sovereigns alone, puts the global greenium at about 1.2 basis points in 2024, halved from 2.5 basis points the year before. In emerging markets, it effectively disappeared as supply caught up with demand.
Sustainability-linked loan margins tell the same story. Reported adjustments run 5 to 25 basis points, structured as a two-way ratchet that steps up if targets are missed rather than as a standing discount.
So the capital is real, the volume is real, and the pricing benefit is a rounding error. Anyone building an investment case on the spread alone is building on the smallest number in the transaction.
Case Study
São Paulo is a useful test of what transition capital actually buys in an emerging market because the physical problem there is unambiguous, but the financial advantage is not.
The metropolitan area holds roughly 21 million people. Annual rainfall has been rising by roughly 53 to 55 millimeters per decade since 1930, and the heavy end has moved fastest. At the IAG-USP station, days above 50 millimeters rose from 52 in 1960 to 1980 to 88 in 2000 to 2019, and days above 100 millimeters rose from 3 to 11.
That is a drainage problem layered onto a density problem. More water arriving faster onto a metropolitan area where impervious surface has expanded for 90 years produces flash flooding on a schedule that has nothing to do with the hundred-year design storm anyone built against.
For a logistics owner, the exposure is specific. A flooded distribution facility isn’t a damaged building. It is a broken link in a customer’s supply chain, and the customer signs the lease.
This is where certification actually earns something. The measured rent premium for certified space runs a few percent, not the double digits often quoted. CBRE finds LEED-certified US offices at just 3.7% over non-certified peers with controls for age, size, renovation, and location. Japanese research on CASBEE-certified buildings finds rent premiums ranging from 2.6% to 5.4%.
Operator-stated premiums for individual portfolios run considerably higher. Those are marketing figures, not controlled studies, and they should not be used to underwrite.
The defensible case for the retrofit in a market like São Paulo is not the rent premium. It is continuity. An asset that remains operational through a flood event retains its tenant, and retaining the tenant is worth substantially more than a few points of rent premium.
The financing structure in an emerging market compounds the problem in a way the transition label does not fix.
A Brazilian logistics asset borrows at a domestic rate that reflects sovereign and currency risk and offers a shorter tenor than a comparable European asset would receive. A greenium of roughly 13 basis points against that base, which is the emerging-market figure rather than the 2 basis points recorded in advanced economies, is not a meaningful input. It does not change debt service, covenant headroom, or refinancing risk.
What does change those things is whether the asset floods. Continuity is the financing story in a market like this, not the label, because a lender pricing a shorter tenor is asking whether the asset performs through the term rather than whether it reports well.
That inverts the usual order of the argument. In a mature market, certification is the accessible lever and physical resilience is the expensive one. In an emerging market with a worsening rainfall trend, physical resilience drives financing, and certification is the paperwork that follows.
Strategic Implications
For a mid-market sponsor, the useful takeaway from this fund is the exit, not the strategy.
Transition capital is your buyer pool, and it has a size floor. A $23.5 billion fund is not buying your single asset. But the managers who feed it, and the institutional buyers running parallel mandates, are the pool your broker is marketing to. What they can hold determines what they can bid.
The screening is based on eligibility, not price. A fund with a Taxonomy or mandate constraint does not discount a non-qualifying asset. It declines to bid, and you never see the bid that was not made.
Do not underwrite the greenium. At 1.2 to 25 basis points, depending on instrument and market, the financing advantage will not carry a deal. Build the case on operating continuity, insurability, and buyer pool, all of which are larger effects.
The asymmetry is the real finding. Certification earns a few percent. Exposure costs far more. First Street’s analysis of 25 years of NCREIF performance data across 120 US metros finds multifamily in high-risk markets trading at roughly a 25% discount to low-risk markets, with 69% higher insurance premiums on average. The downside is an order of magnitude larger than the upside, which means the defensive case is stronger than the offensive one.
Future Signal
So what is a practical sequence for anyone underwriting into a market like São Paulo?
Start with the drainage catchment rather than the parcel. Flash flooding in a dense metropolitan area depends on upstream impervious surface and channel capacity, neither of which appears in a site survey.
Then ask what the tenant’s continuity requirement actually is. A distribution facility serving a just-in-time customer has a tolerance measured in hours. That tolerance, not the building’s replacement cost, is what determines whether a resilience investment pencils.
Then price the insurance, and check whether it is available at all. In markets where flood coverage is thin, resilience spending buys insurability rather than a premium discount, which is the same finding Brief 29 reached on wildfire retrofits in California.
There are three things to watch -
Whether transition funds move down-market. Deployment pressure at this scale eventually pushes managers toward smaller assets and programmatic joint ventures. When it does, mid-market sponsors become counterparties rather than spectators, and the documentation burden arrives with the capital.
Whether the greenium recovers or stays compressed. It halved globally in 2024 as issuance caught up with demand. If it stays near zero, the label becomes purely an access mechanism rather than a pricing mechanism, which changes the calculus for issuers weighing reporting costs.
Whether emerging-market transition capital prices physical risk properly. São Paulo has a documented and worsening rainfall trend. If capital flows there on transition themes without underwriting the drainage exposure, the next repricing will arrive as an insurance event rather than a policy one.
Whether deployment pressure erodes discipline. A fund with $23.5 billion and a finite investment period faces a clock. Capital that must be placed tends to broaden its criteria as the deadline approaches, and assets bought in the final third of an investment period have historically underperformed those bought in the first. Watch what gets added late.
The pattern across this month is consistent. Capital is moving, the direction is clear, and the pricing signals are smaller and noisier than the headlines. The investors who do well from this will be those who underwrite the physical exposure and treat the label as a filter rather than a return driver.
One closing observation for a sponsor reading this from outside the institutional tier. None of these funds are competing for your assets, and none of them are going to buy your building directly. What they do is set the standard that buyers one level below them must meet, because those buyers are raising capital from the same allocators.
That is how a $23.5 billion fund reaches a fifty-unit deal in a secondary market. Not through the transaction, but through the criteria that travel down the capital stack and arrive as a condition in someone else’s term sheet.
Brief 13 looked at the allocator layer and what GRESB participation does and does not prove. Brief 17 takes the argument into industrial triple-net leases, where insurance costs in Dallas rose 15% a year, and the recovery clause did not keep pace.
As always, KNOW YOUR SIGNALS and BE CLIMATE READY!
Jamie
Run this on your own deal
The CRDF Signal Tracker™ built for this brief lets you log capital flow and eligibility signals in your markets, translate them into financial impact, and score which ones are moving your pricing. Free, no signup: Brief 16 - CRDF Signal Tracker™ (xlsx)
New to the framework? The blank master Signal Tracker and Deal Stress Test workbooks are at climatereadyre.com/tools.
Related briefs
Same signal (S3 Capital Allocation Flows):
Brief 13 · GRESB Participation and Real Estate Returns: What $9 Trillion in Capital Screens For
Brief 7 · Sustainable Real Estate Fund Flows and the Green Premium: $84B Went Out
Brief 12 · Climate Disclosure Rules for Real Estate in 2026: CSRD, SB 253, and What Changed
Next in sequence:
Brief 17 · Industrial Insurance Costs and Triple Net Recovery: 15% a Year in Dallas - coming soon
Sources
Every figure above, with the date the data covers, the date it was published, and the date I verified it.
Brookfield Global Transition Fund II — $20 billion final close, $23.5 billion including roughly $3.5 billion of co-investment.
Brookfield Asset Management — Brookfield Raises $20 billion for Record Transition Fund · Data as of Oct 7, 2025 · Published Oct 7, 2025 · Accessed Sep 2026
GRESB benchmark scale and net-zero adoption — 1,002 managers; 81.5% of participants held formal net-zero policies in 2025, up from 78.8% in 2024 and 72.4% in 2023.
GRESB — 2025 Real Estate Assessment Results · Data as of 2025 · Published Oct 15, 2025 · Accessed Aug 2026
Participation is self-selecting, so the figures measure the benchmarking pool rather than the whole market.
Private equity real estate climate strategy adoption — more than half of capital raised by the twenty largest firms carried a formal climate strategy in recent vintages.
PERE — private equity real estate market coverage · Data as of 2021–2024 · Published 2025 · Accessed Aug 2026
Trade-press estimation rather than a published dataset.
Green, social and sustainability bond issuance — USD 1.1 trillion of debt aligned with Climate Bonds’ methodology in 2024, across green, social, sustainability and sustainability-linked instruments.
Climate Bonds Initiative — Climate Bonds publishes provisional 2024 numbers · Data as of 2024 · Published Jan 9, 2025 · Accessed Sep 2026
Sovereign and quasi-sovereign green bond greenium — about 2 basis points in advanced economies against about 13 basis points in emerging markets, from 332 matched bond pairs, 2014–2023.
CEPR — Discussion Paper 20817 · Data as of 2014–2023 · Published Nov 6, 2025 · Accessed Aug 2026
Panizza, Shi, Weder di Mauro and Gulati. Sovereign and quasi-sovereign issuance only, not the whole green bond market. The 13 basis point emerging-market figure applies to an emerging-market asset.
2024 greenium compression — halved to roughly 1.2 basis points globally in 2024, from 2.5 basis points in 2023, and effectively disappeared in emerging markets as supply caught up with demand.
IFC and Amundi — Emerging Market Green Bonds 2024 · Data as of 2024 · Published Jun 2025 · Accessed Sep 2026
Sustainability-linked loan margins — reported rate adjustments of 5 to 25 basis points, structured as a two-way ratchet; Pinsent Masons documents the lower margins and the ratchet structure, and the basis-point range is reported market practice rather than a figure it publishes.
Pinsent Masons — Green loans market adapting to borrower needs · Data as of 2026 · Published Mar 4, 2026 · Accessed Sep 2026
São Paulo scale and rainfall trend — roughly 21 million people in the metropolitan area; annual precipitation rising about 53 mm per decade at Mirante de Santana and about 55 mm per decade at IAG-USP over 1930 to 2019; days above 50 mm rose from 52 to 88 between 1960 to 1980 and 2000 to 2019 at IAG-USP, and days above 100 mm rose from 3 to 11.
Frontiers in Climate — Changing Trends in Rainfall Extremes in the Metropolitan Area of São Paulo · Data as of 1930s–2020s · Published 2020 · Accessed Aug 2026
Verified at source Sep 2026. The paper reports decadal trends rather than endpoints and uses daily thresholds from R10 to R100; it states no 40 mm threshold and no absolute annual totals, so neither was carried forward. The population figure is the 2022 census count for the Região Metropolitana de São Paulo, 20,743,587, per IBGE as reported by Observatório das Metrópoles on July 27, 2023.
Certification rent premium — LEED-certified US offices 3.7% controlling for age, size, renovation and location; CASBEE-certified Japanese buildings 2.6% to 5.4%.
CBRE — Green Is Good: The Endurance of the Rent Premium in LEED-Certified US Office Buildings · Data as of 2022 · Published Oct 26, 2022 · Accessed Aug 2026
Operator-stated premiums for individual portfolios run considerably higher and are marketing figures rather than controlled studies. The CASBEE range is from Onishi, Deng and Shimizu, Sustainability 13(21):12227 (2021), on Tokyo office contract rents from 2009 to 2019, after propensity-score controls for building quality.
Multifamily price gap and insurance premiums in high-risk markets — multifamily properties in high-risk markets trade at a 25% discount to those in low-risk areas, and carry 69% higher premiums on average.
Bisnow — Insurance Drags Down Property Values By 17% In Climate-Sensitive Markets, Study Shows · Data as of 25 years of NCREIF data across 120 US metros · Published May 5, 2026 · Accessed Sep 2026
Bisnow reports both figures and names First Street as the primary source—the firm’s first attempt to quantify climate risk impact on commercial real estate performance, built on 25 years of National Council of Real Estate Investment Fiduciaries (NCREIF) performance data across 120 US metro areas. The First Street report page itself sits behind a terms-acceptance gate and could not be opened, so this remains a credible secondary source rather than the primary document.
Commentary and analysis only. Not investment, financial, legal, tax, or professional advice. CRDF tools are illustrative; examples are composites drawn from public data. Do your own due diligence and consult qualified professionals.
I run this analysis on specific deals. If you are positioning an asset for an institutional or transition-capital exit and want the eligibility and physical risk assumptions pressure-tested before you commit, book 20 minutes.
Jamie Wolf, MBA — Founder & Publisher, Climate-Ready Real Estate Investing, © 2026, CR REI Holdings LLC