

Signals: S12 Resilience Economics & Retrofit · S6 Chronic Climate Stress · S4 Valuation & Appraisal Gap
On Thursday, we followed catastrophe risk into the bond market, a record market with almost no property owners. Today we come down to a single roof.
When a building costs less to run in the heat, who keeps the money?
Market Signal
The National Oceanic and Atmospheric Administration (NOAA), the federal weather and climate agency, has published cooling degree days for California since 1895. A cooling degree day measures how far the average temperature sits above 65 degrees Fahrenheit on a given day. Added up across the year, it measures heat the way a utility bill feels it, and it’s the standard yardstick for how hard cooling equipment has to work.
The six highest years in that 131-year record are 2020 at 1,206, 2022 at 1,205, 2024 at 1,192, then 2017, 2015, and 2021. All of them have come since 2015.
The same series puts 2023 at 866 and 2025 at 951, both well below the recent ten-year average of about 1,075. So this is a rising trend with wide yearly swings, not a ratchet. An operator budgeting off last summer will be wrong either way. Over the long view, California has warmed almost 3 degrees Fahrenheit since the start of the 20th century.
Pacific Gas and Electric (PG&E), the utility serving much of Northern and Central California, uses Schedule B-19. B-19 is the time-of-use tariff for large commercial customers, so prices change by the hour and the season. Energy costs about 18.6 cents per kilowatt-hour during summer peak (4 to 9 p.m. every day) and 12.0 cents off-peak. On top of that, B-19 charges $46.16 per kilowatt for the store’s highest draw during summer peak, and $37.37 per kilowatt for its highest draw at any hour.
Those are demand charges. In other words, the store pays for both the energy it uses over time, measured in kilowatt-hours, and its highest moment of power draw. B-19 is mandatory once a customer’s billing demand has run above 499 kilowatts for three months in a row. Stores still on the older E-19 schedule must move to B-19 when E-19 expires, currently scheduled for 2027, and their peak window shifts from noon to 6 p.m. on weekdays to 4 to 9 p.m. Supermarket refrigeration runs around the clock and can’t choose between peak and non-peak.
The demand charge is where a cooling technology earns its keep, or doesn’t.
Case Study
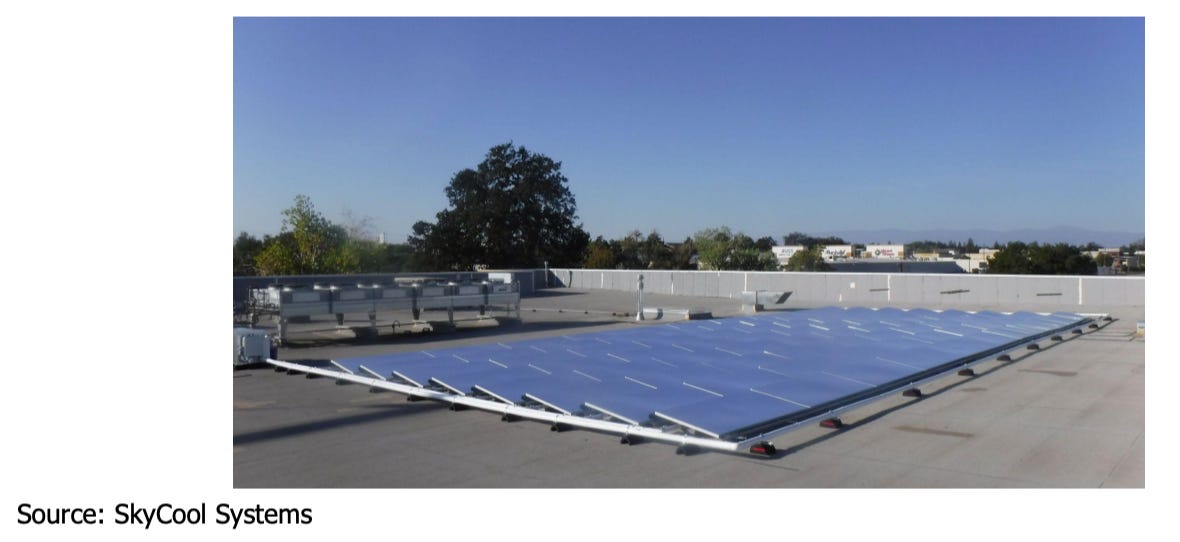
The case involves a company called SkyCool Systems, founded out of Stanford by Shanhui Fan, Aaswath Raman, and Eli Goldstein. They have adapted a technology called radiative sky cooling for use on buildings. Their rooftop panels carry a multilayer optical film that reflects sunlight and sheds heat to the sky. That cools fluid without electricity or evaporating water.
The field test ran at two operating supermarkets. One is in Red Bluff, in the northern Sacramento Valley. The other is in Milpitas, south of San Francisco Bay. SkyCool switched the array’s pump on and off at a working store, measured the refrigeration system’s power and capacity, and normalized for weather. Eli Goldstein, SkyCool’s co-founder, prepared the report. The California Energy Commission (CEC), the state’s energy policy and planning agency, published the results in January 2025 as report CEC-500-2025-002.
The Electric Power Research Institute (EPRI), an industry research nonprofit, wrote the measurement plan but had limited involvement in the final analysis because it lacked available project funds. In other words, these figures are SkyCool’s own measurements, published by the state, not a state evaluation.
At Red Bluff, an 80-panel array fed the refrigeration condenser, which dumps the heat pulled from the display cases. SkyCool reports a maximum energy saving of 15%. That’s the best case over the hours the array was working, not an annual average. Refrigeration power demand fell 5 to 7 kilowatts. The array added 30 to 45 kilowatts of heat rejection, a 34% increase. It cut discharge pressure, which the compressor pushes against, by up to 50 psi (pounds per square inch). Over the test period, it saved 27,000 kilowatt-hours.
At Milpitas, a 60-panel array added 10 to 25 degrees Fahrenheit of subcooling. Subcooling chills the liquid refrigerant further, so it absorbs more heat in the cases. The report states a 15% to 20% reduction in energy use, and a 14% efficiency gain when the outside air was below 75 degrees.
The annual figure of nearly 20,000 kilowatt-hours is extrapolated from 340 days of data. It was not measured over a full twelve months. SkyCool also says that, as a precooler, the array only saves energy when the ambient air is roughly 80 degrees or warmer. So the savings come in summer.
Two numbers an owner or a lender needs first are missing. Neither store’s total annual electricity use or cost appears in the report, so we can’t express the savings as a share of the bill. No source we found includes installed cost, price per panel, or payback. Without a cost, there’s no return to underwrite.
So we applied the B-19 rates to the measured kilowatt-hours and kilowatts. This is a tariff illustration, not either store’s bill, since neither tariff is published, and a demand cut only earns the peak charge if it lands on the store’s own peak.
Based on the company’s reported results from its own technology, savings are worth between $2,856 and $7,374 per store per year. Kimco Realty, a large owner of grocery-anchored shopping centers, reports buying $109 million of property through July 31, 2026, at a 5.7 percent weighted-average cap rate. A cap rate is net operating income divided by price, so a lower cap rate means a higher price. At 5.7 percent, the savings capitalize to $50,102 to $129,365.
But whose value is it?
Strategic Implications
Under the lease that dominates US retail, the grocer keeps the savings, and the landlord never sees them.
That lease is the triple-net, or NNN, lease. The tenant pays base rent plus its share of the property’s taxes, insurance, and maintenance, the “nets” that give the lease its name. Maintenance usually arrives as common area maintenance, or CAM, charges for shared spaces such as the parking lot. The landlord typically pays those costs and bills tenants back. Those bill-backs are called pass-throughs, or recoveries.
The law firm Holland & Knight wrote in March 2026 that triple-net leases are most common in retail spaces, and that utilities sit in the tenant’s column. Even a full-service gross lease, where rent covers operating costs, commonly carves out separately metered utilities to the tenant. A supermarket’s refrigeration rack is the anchor’s own equipment on its own meter. The Department of Energy (DOE) named the mechanism back in 2016. The owner covers capital costs, and the tenant covers operating costs.
If you’re like me, that sounds backward, because a cheaper-to-run building should be worth more. Regency Centers, another grocery-anchored owner, defines property net operating income in its 2025 annual report as tenant recoveries, other lease income, and other property income, less operating and maintenance expenses, taxes, ground rent, and termination expense.
A landlord-paid expense gets billed back as a recovery. A tenant-metered utility never appears on the landlord’s statement, either side.
In other words, the savings never reach the landlord’s net operating income. The $50,102 to $129,365 from the case study is value built on money the property owner doesn’t receive.
Kimco reported its same-property net operating income rose 3.5% in the second quarter of 2026, and Regency reported 3.8%. The market is paying full price for grocery-anchored income, and none of that value rests on the anchor’s refrigeration bill.
So where do the savings go? To the grocer, where it matters most.
FMI, the Food Industry Association, reports that grocery profit margins averaged 2.1% in 2025. At that margin, saving a dollar on energy is worth about $47.60 in extra sales.
That sounds large, but a grocer keeps only a sliver of each sales dollar, while a dollar not spent on electricity is full profit. On today’s margin, our $2,856 to $7,374 band is the profit on roughly $136,000 to $351,000 of groceries per store per year.
An owner captures the savings in exactly three structures.
One: the owner occupies the box.
Two: the lease is full-service gross, and the utility is not carved out.
Three: a contract moves the meter.
Energy-as-a-service providers such as Budderfly take over the customer’s utility bill under a standard 10-year contract, so the provider keeps the savings. There’s also an indirect route. Lower occupancy costs strengthen the anchor, which is worth something at renewal. But against a supermarket’s rent, it’s small and slow, and we found no source that puts a number on it.
Does efficiency lift net operating income in general?
The one study that tested it against real owner operating statements is both outdated and not relevant to retail grocery. It is DOE/EE-1568, from May 2017, almost ten years ago. It found a 28.8% rise in net operating income per square foot and a 17.6% cut in operating expenses per square foot for green buildings. But it covers one owner’s 131 office properties, controlled only for building size, and the authors say it wasn’t designed to show causation. No study we found reports the same measure for grocery-anchored retail.
Future Signal
Watch for three things over the next 12 to 24 months.
First, the refrigeration clock just moved. In May 2026, the Environmental Protection Agency (EPA) finalized changes to its technology transitions rule for hydrofluorocarbons (HFCs). HFCs are common supermarket refrigerants and potent greenhouse gases. The changes are effective July 27, 2026.
New supermarket systems may use refrigerants with a global warming potential of up to 1,400 starting January 1, 2027. Global warming potential compares a gas’s heat-trapping ability to that of carbon dioxide. The stricter limits of 150 or 300 now start on January 1, 2032. For remote condensing units, the deadline moved six years, from 2026 to 2032. The grocer usually owns that rack, so the decision to replace it has more time and still rests with the tenant.
Second, watch where retrofit money goes. Commercial PACE, or Property Assessed Clean Energy, is financing repaid through the property tax bill. PACENation, the industry’s trade group, counts $13.5 billion of cumulative commercial PACE investment across 3,837 projects through December 2025. Of that, 55% went to energy efficiency and 3% to resiliency. PACE is overwhelmingly an efficiency instrument, whatever it’s called in a pitch deck.
Third, watch for the independent result. The DOE’s Advanced Research Projects Agency-Energy (ARPA-E) still describes demonstrated energy savings from supermarket installations as a goal of the SkyCool project on its program page. The often-quoted 21% saving from the original Stanford work in 2017 was a simulation of a hypothetical office building in Las Vegas, not a measurement. A full-year, weather-normalized, independently verified result on a commercial building would change this conversation. As of this writing, none exists.
I expect landlords will sell cooling technology on retail roofs through the tenant and via energy-as-a-service contracts, not directly, as long as the triple-net lease holds. Landlords who capture value will be the ones who wrote the meter into the deal.
Stakeholder Takeaway
If you own grocery-anchored centers, read the lease before modeling a cooling retrofit into value. If the anchor is separately metered on a triple-net lease, the grocer gets the savings. Your angle is the renewal, not the net operating income.
If you are a grocer or an operator, the economics are yours, and on a 2.1% margin they’re large. Ask any vendor for two numbers. One is the installed cost. The other is a full-year, weather-normalized result on a store like yours. A vendor that can’t supply both is asking you to buy on faith.
If you are a lender or a buyer, don’t put a pitch deck’s savings into a landlord’s underwriting until you know who pays the utility bill.
If you provide or invest in energy-as-a-service, the lease is the product. You’re buying the meter.
As always, KNOW YOUR SIGNALS and BE CLIMATE READY!
Jamie
Run this on your own deal
The CRDF Signal Tracker™ built for this brief lets you log the seven items this brief turns on: California cooling degree days, PG&E’s B-19 rates and the scheduled 2027 end of E-19, the SkyCool field test results, grocery-anchored net operating income and cap rates, the EPA refrigerant dates, commercial PACE spending, and the independent result that has yet to appear, with every entry dated and sourced. Free, no signup: Brief 46_CRDF Signal Tracker™ (xlsx)
New to the framework? The blank master CRDF Signal Tracker™ and Deal Stress Test™ workbooks are at climatereadyre.com/tools.
Related briefs
Same signal (S12 Resilience Economics & Retrofit):
Brief 44 · Natural Hazards Rules for Developers: What New Zealand’s 2026 Policy Costs
Next in sequence:
Brief 47 · Multifamily Hail Insurance: Pricing & Carrier Trends
Sources
Every figure above includes the data coverage date, the publication date, and the date I verified it.
The heat record — the six highest California cooling degree day years are 2020 at 1,206, 2022 at 1,205, 2024 at 1,192, then 2017, 2015, and 2021; 2023 at 866 and 2025 at 951.
NOAA NCEI, Climate at a Glance, statewide time series 4, California annual cooling degree days, base 65 degrees Fahrenheit · Data as of 2025 · Published Updated through 2025 · Accessed Sep 2026
A statewide series with wide yearly swings. The ten-year average of about 1,075 is CRREI arithmetic on NOAA’s own annual values.
The long view — California has warmed almost 3 degrees Fahrenheit since the start of the 20th century.
NOAA NCICS, State Climate Summaries 2022, California · Data as of 2020 · Published 2022 · Accessed Sep 2026
A 2022 summary with a record through 2020. The cooling degree day series above is the current measure of the same trend.
The tariff — about 18.6 cents per kilowatt-hour at summer peak (4 to 9 p.m. every day) and 12.0 cents off-peak; $46.16 per kilowatt of summer peak demand and $37.37 per kilowatt of maximum demand; mandatory above 499 kilowatts.
Pacific Gas and Electric Company, Electric Schedule B-19 (Advice 7846-E) · Data as of Sep 2026 · Published Effective Mar 1, 2026 · Accessed Sep 2026
Neither test store’s tariff is published. B-19 is mandatory only above 499 kilowatts and voluntary below it.
The schedule change — E-19 is currently scheduled to expire in 2027, when its customers move to B-19 and their summer peak moves from noon to 6 p.m. on weekdays to 4 to 9 p.m.
Pacific Gas and Electric Company, Electric Schedule E-19 · Data as of Sep 2026 · Published Sheet read Sep 26, 2026 · Accessed Sep 2026
Currently scheduled so that the date can move. The sheet’s effective date was not captured.
Red Bluff — 80 panels; 15% maximum energy savings; 5 to 7 kilowatts of demand cut; 30 to 45 kilowatts of added heat rejection (a 34% increase); discharge pressure reduced by up to 50 pounds per square inch; 27,000 kilowatt-hours saved.
California Energy Commission, CEC-500-2025-002, prepared by Eli Goldstein, SkyCool Systems, Inc. (agreement EPC-18-006) · Data as of 2023-2024 · Published Jan 2025 · Accessed Sep 2026
Vendor-measured. The 15% is a maximum over working hours, never an annual average.
Milpitas — 60 panels; 10 to 25 degrees Fahrenheit of subcooling; a stated 15% to 20% reduction in energy use and a 14% efficiency gain below 75 degrees.
California Energy Commission, CEC-500-2025-002, prepared by Eli Goldstein, SkyCool Systems, Inc. (agreement EPC-18-006) · Data as of 2023-2024 · Published Jan 2025 · Accessed Sep 2026
Vendor-measured. The report gives two different efficiency figures for the same site.
The annual figure and the method — nearly 20,000 kilowatt-hours per year, extrapolated from 340 days of data; savings only when the ambient air is roughly 80 degrees or warmer; EPRI wrote the measurement plan but had limited involvement in the final analysis.
California Energy Commission, CEC-500-2025-002, prepared by Eli Goldstein, SkyCool Systems, Inc. (agreement EPC-18-006) · Data as of 2023-2024 · Published Jan 2025 · Accessed Sep 2026
Extrapolated, not measured over twelve months. The pump on-and-off method is a real control, but the analysis is the vendor’s own.
The publisher — prepared by SkyCool’s co-founder and published by the California Energy Commission in January 2025.
California Energy Commission, CEC-500-2025-002 publication page and report face · Data as of Jan 2025 · Published Jan 2025 · Accessed Sep 2026
A CEC publication number is not a CEC endorsement. The Commission states it has not approved or disapproved the report.
What the vendor publishes — no savings percentage, no price, and no payback on the product page.
SkyCool Systems, panel product page · Data as of Sep 2026 · Published Undated, read Sep 23, 2026 · Accessed Sep 2026
A vendor page, cited only for what it does not publish.
The 2017 work — the founders’ radiative cooling research; the often-quoted 21% saving was a simulation of a hypothetical office building in Las Vegas.
Raman, Goldstein and Fan, Nature Energy, September 4, 2017, via Stanford School of Engineering (Taylor Kubota) · Data as of 2017 · Published Sep 8, 2017 · Accessed Sep 2026
A simulation, not a measurement, and cited only to show that.
The cap rate and Kimco’s income — $109 million of acquisitions through July 31, 2026 at a 5.7 percent weighted-average cap rate; same-property net operating income up 3.5% in the second quarter of 2026.
Kimco Realty, Second Quarter 2026 Results · Data as of Jul 31, 2026 · Published Aug 4, 2026 · Accessed Sep 2026
The issuer’s own disclosure. The 5.7 percent figure is updated through July 31, 2026.
The lease — triple-net leases are most common in retail spaces, with utilities in the tenant’s column; gross leases commonly carve out separately metered utilities.
Holland & Knight (Mackenzie Taylor Cietek), “Who Pays for What? Understanding Key Differences in Triple Net, Gross and Modified Gross Commercial Leases” · Data as of Mar 2026 · Published Mar 10, 2026 · Accessed Sep 2026
A law firm’s general guide to lease conventions, not a survey of leases.
Split incentive: the owner pays capital costs, and the tenant bears operating costs.
US Department of Energy, “Energy Efficiency in Separate Tenant Spaces - A Feasibility Study”, mandated by the Energy Efficiency Improvement Act of 2015 · Data as of Apr 2016 · Published Apr 2016 · Accessed Sep 2026
A 2016 baseline. Holland & Knight’s 2026 guide is the current statement of the same mechanism.
Regency’s definition of net operating income — tenant recoveries, other lease income, and other property income, less operating and maintenance expenses, taxes, ground rent, and termination expense.
Regency Centers Corporation, Form 10-K for fiscal 2025, and the Q2 2026 earnings call · Data as of FY 2025 · Published Feb 13, 2026 · Accessed Sep 2026
The issuer’s own filing. A tenant-metered utility enters neither side of the statement.
Regency’s income — same-property net operating income up 3.8% in the second quarter of 2026.
Regency Centers Q2 2026 earnings call - Nicholas Andrew Wibbenmeyer (West Region President and Chief Investment Officer) and Alan Todd Roth (East Region President and Chief Operating Officer), via The Motley Fool transcript · Data as of Q2 2026 · Published Aug 8, 2026 · Accessed Sep 2026
A transcript of the earnings call, used as attributed context.
The grocer’s margin — grocery profit margins averaged 2.1% in 2025.
Supermarket News (Supermarket News Staff), reporting FMI - The Food Retailing Industry Speaks 2026 · Data as of 2025 · Published Jul 7, 2026 · Accessed Sep 2026
A trade summary of FMI’s report. An industry average, not either test store’s margin.
Energy-as-a-service — Budderfly takes over the customer’s utility bill on a standard 10-year contract, so the savings land on the provider’s side.
Canary Media (Jeff St. John), “A novel way to improve energy efficiency: take over the utility bill” · Data as of 2023 · Published Jan 23, 2024 · Accessed Sep 2026
Cited for the structure only. The company’s own savings figures are not independently verified.
The one study — a 28.8% rise in net operating income per square foot and a 17.6% cut in operating expenses per square foot for green buildings, across one owner’s 131 office properties.
Deborah Cloutier, Farshid Hosseini and Andrew White (JDM Associates) for the US Department of Energy Building Technologies Office, DOE/EE-1568 · Data as of 2017 · Published May 2017 · Accessed Sep 2026
Controlled for building size only, and the authors disclaim causation. Office, not retail, and silent on lease structure.
The refrigerant dates — effective July 27, 2026; a global warming potential of up to 1,400 for new supermarket systems from January 1, 2027; 150 or 300 from January 1, 2032; remote condensing units moved six years, from 2026 to 2032.
US EPA, Federal Register - Phasedown of Hydrofluorocarbons: Reconsideration of Certain Regulatory Requirements Promulgated Under the Technology Transitions Provisions of the AIM Act of 2020 · Data as of May 2026 · Published May 26, 2026 · Accessed Sep 2026
A final rule. It supersedes compliance dates in trade articles written before it.
Where PACE money goes — $13.5 billion of cumulative commercial PACE investment across 3,837 projects; 55% to energy efficiency and 3% to resiliency.
PACENation, PACE Market Data · Data as of Dec 2025 · Published Aug 13, 2026 · Accessed Sep 2026
A trade association’s compilation of program data. The date shown is the page’s last modification.
The independent result—demonstrated energy savings from supermarket installations —remains a stated goal of the SkyCool project.
ARPA-E (US Department of Energy), SCALEUP program project page: Saving Energy In Commercial and Industrial Refrigeration Systems Using Radiative Sky Cooling · Data as of Sep 2026 · Published Undated, read Sep 23, 2026 · Accessed Sep 2026
An undated program page. A goal, not an output.
The tariff illustration, capitalized value, and sales equivalent — $2,856 to $7,374 per store per year from the measured kilowatt-hours and kilowatts at B-19 rates; $50,102 to $129,365 at a 5.7 percent cap rate; about $47.60 of sales per dollar saved at a 2.1% margin; $136,000 to $351,000 of groceries per store per year.
CRREI modeled scenario · Method: CRREI arithmetic on the CEC field test, PG&E Schedule B-19, Kimco’s cap rate, and FMI’s margin. Energy value is kilowatt-hours times the per-kilowatt-hour rate, and demand value is kilowatts times the per-kilowatt rate over the four summer months, with the low end charging the $37.37 rate alone and the high end adding the $46.16 peak rate. Capitalized value equals annual savings divided by the cap rate, and sales equivalent equals savings divided by the margin. · Modeled — not a specific asset
A tariff illustration, not either store’s bill, because neither store’s tariff is published. The high end assumes the demand cut lands on the store’s own peak. The capitalization assumes the owner receives the savings, which it does not under a triple-net retail lease.
Commentary and analysis only. Not investment, financial, legal, tax, or professional advice. CRDF tools are illustrative; examples are composites drawn from public data. Do your own due diligence and consult qualified professionals.
I run this analysis on specific deals. If you are modeling a cooling retrofit into a grocery-anchored center, book 20 minutes.
Jamie Wolf, MBA — Founder & Publisher, Climate-Ready Real Estate Investing, © 2026, CR REI Holdings LLC