

Signals: S9 Zoning, Codes & Land Use · S5 Acute Climate Hazard · S12 Resilience Economics & Retrofit
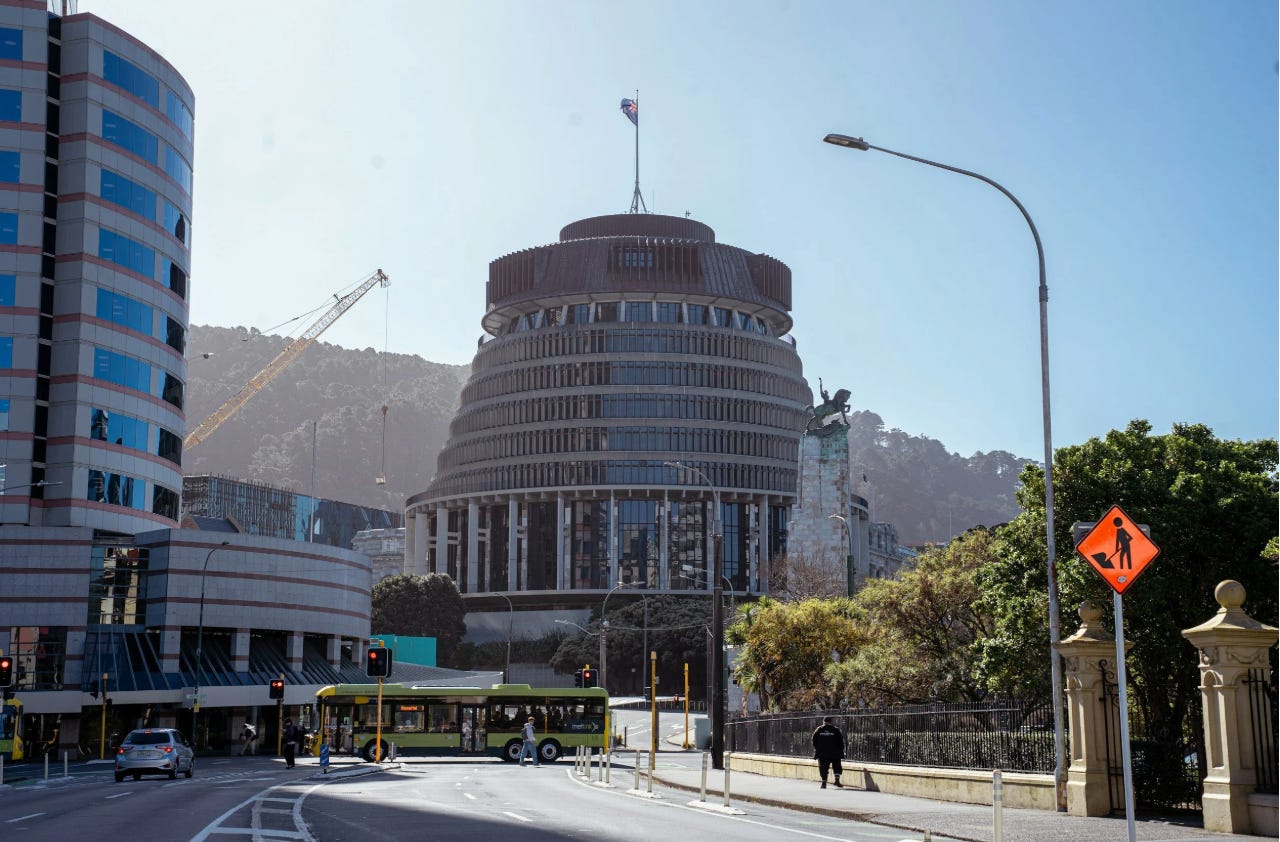
Photo: The Beehive (Te Whare Mīere), the iconic executive wing of the New Zealand Parliament Buildings, located at the corner of Molesworth Street and Lambton Quay in Wellington.
On Monday, a court asked whether a firm’s climate words matched its own holdings. Today the test comes from a national planning rule in New Zealand. We’ll price it for a developer before the first shovel hits the ground.
Market Signal
For the last thirty years, New Zealand’s planning and building systems followed a tiered structure. National directives set the overarching framework via National Policy Statements (NPS) and National Environmental Standards (NES). Local councils (regional and district/city councils) wrote rules to implement those national policies.
Currently, New Zealand is undergoing its most significant planning system transformation in over three decades. A split-framework system is replacing the Resource Management Act 1991 (RMA). The first half is the Planning Act, which controls how land is used, developed, and enjoyed. The other half is the Natural Environment Act, which focuses exclusively on environmental protection and enhancement.
Public submissions closed on September 24, 2026, on Auckland Council’s Plan Change 120, which would limit development in areas at high flood, landslide, and coastal risk. And according to the Resource Management Law Association, the bills that replace the RMA passed their third reading in Parliament. They take effect on royal assent, the formal final step that turns a bill into law, with the new system intended to be fully operational by 2030.
Under the new split system, the government is consolidating national policy statements and environmental and policy standards into a single, comprehensive framework: the National Policy Direction (NPD) and National Standards. At a local level, more than 100 separate local plans are being collapsed into just 17 Regional Combined Plans (one comprehensive plan per region).
New Zealand’s National Policy Statement for Natural Hazards (NPS-NH) 2025 was gazetted (officially published in the New Zealand Gazette) on December 18, 2025, and came into force on January 15, 2026.
The NPS-NH risk matrices, hazard criteria, and rules will eventually be permanently integrated into the new statutory tools under the Planning Act (which governs land use and subdivision) to guide long-term development decisions. NPS-NH is central government direction that local councils must follow in planning decisions during the transition. It covers seven hazards: flooding, landslips, coastal erosion, coastal inundation, active faults, liquefaction, and tsunami.
The Ministry for Cities, Environment, Regions and Transport (MCERT)’s National Policy Statement on Natural Hazards – Implementation Guide sets likelihood in seven bands. These bands run from almost certain (10% or greater annual chance) to very rare (less than 0.02%). Likelihood is crossed with consequence to rate risk as low, medium, high, or very high. In other words, how often could the hazard happen, and how bad would it be?
Two policies do most of the work for a developer. Policy 3 says that where development is assessed as very high risk, that risk must be avoided. Policy 6 says climate impacts to at least 100 years into the future must be considered.
New Zealand’s councils are its local governments, and each kept a district plan, the council’s land use rulebook, much like a US zoning code. Building something the plan didn’t allow outright required a “resource consent”. The council granted that permit under the former Resource Management Act (RMA). According to law firm Wynn Williams, councils must now consider NPS-NH when deciding on resource consents.
The Treasury, New Zealand’s finance ministry, estimates the 2023 extreme weather events cost between NZ$9 billion and NZ$14.5 billion. Those were the Auckland Anniversary floods and Cyclone Gabrielle. Private insurers paid about NZ$4 billion, leaving a shortfall of NZ$5 billion to NZ$10.5 billion. The 2020 National Climate Change Risk Assessment put about 675,000 people in inland flood hazard areas, with an estimated 411,500 buildings exposed.
Deal Scenario
Let’s look at a modeled scenario, meaning the numbers are not pulled from any actual deal.
The project is twenty townhouses on a 2,000-square-meter brownfield site (previously developed and usable after cleanup) in Henderson, West Auckland, built to sell. We chose West Auckland because it flooded in January 2023.
Land is priced at three suburb-average houses at NZ$862,700 each, or NZ$2,588,100. Build cost uses the Auckland average from Stats NZ, the national statistics agency, of NZ$3,270 per square meter over 139 square meters, or NZ$454,530 per unit. We add Auckland’s development contributions, council infrastructure fees similar to US impact fees, of about NZ$20,000 per unit, plus a NZ$12,000 consent deposit.
Finance comes from a published non-bank range. The rate is 9.5%, at 65% loan-to-cost, meaning the lender funds that share of the total project cost. There’s a 2% establishment fee and a 1.2% annual line fee on the full limit. We allow six months before construction and eighteen months of build. Each unit sells at the Henderson average of NZ$862,700.
Scenario A is before the hazards rule change. In our model, it makes NZ$2,612,094, a 15.14% margin on gross development value (total sales revenue from all units).
Scenario B adds the policy, i.e., New Zealand’s National Policy Statement for Natural Hazards, or the planning rule. That means a NZ$100,000 quantified risk assessment (the Ministry’s own impact statement says it could cost more for a multi-site development), floor raising to elevate for flood levels at the Ministry’s mid figure of NZ$50,000 per unit, and three months of consenting delay. In our modeled scenario, the margin falls to 7.77%, a profit of NZ$1,340,074.
At the Ministry’s low floor-raising figure, the margin is 11.51%. At the high figure, with a six-month delay, the project loses NZ$259,880.
Of the NZ$1,272,020 in national policy or hazards rule costs, floor raising is NZ$1,076,862, or about 84.7%. The risk assessment is 8.5% of it, and just 0.58% of gross development value. The delay costs NZ$87,667. The paperwork is cheap. The concrete is expensive.
Scenario C tests the buyer.
Cotality, a property data and analytics company, measured upfront discounts of NZ$70,000 to NZ$100,000 on flood-susceptible homes in Mount Albert. If we apply the low end to every unit, the modeled project loses NZ$14,698, a margin of -0.09 %. Applying another suburb’s discount to Henderson is strictly an assumption.
It isn’t the policy. It’s the sale price.
In our modeled scenario, a 10% higher price takes Scenario B to 15.95%, and a 10% lower price takes it to -2.30 %. That swing is bigger than the whole hazards rule policy package, and at Henderson’s 12-month median asking price of NZ$800,750, the margin is 0.88%.
Current listings show smaller two-bedroom new builds in Henderson asking roughly NZ$540,000 to NZ$650,000. Those are asking prices, not sales, but they suggest NZ$862,700 per unit is a generous, not safe, assumption.
Underwriting Analysis
One. Buy the assessment before the site.
Under Policy 3, a resource consent for very high-risk development isn’t available at any price. In our modeled scenario, a failed site leaves the developer out NZ$100,000 for the assessment plus NZ$184,402 in land interest over nine months. That’s NZ$284,402 before any land write-down, which no source quantifies.
The Ministry’s interim analysis in April 2025 said most regulated parties would face marginal costs unlikely to exceed NZ$10,000. A multi-site project is well past that.
Two. Price the floor, not the form.
The impact statement puts floor raising at NZ$20,000 to NZ$50,000, and NZ$50,000 to NZ$120,000 per dwelling. It calls for the total cost, not the marginal cost. We treated it as fully additional, which overstates the hit. It still does the most damage, so get a real quote at feasibility.
Three. Read the insurance tail, because it has grown.
In May 2024, the Reserve Bank of New Zealand, the country’s central bank, found that about 20% of quotes for high flood risk properties carried extra flood premiums averaging NZ$250 or more per year. A newer Treasury data collection, prepared by the consultancy Finity and published in February 2026, found that just under half of quotes in high flood-risk locations carried significant flood pricing. The largest estimated flood premium was NZ$9,250, against NZ$4,250 the year before.
Capitalized at Henderson’s 3.6% yield, NZ$9,250 per year is worth about NZ$256,944 of house value in our modeled example. That’s 3.7 times the Mount Albert discount.
In other words, the insurance premium alone can now set a house price.
The Natural Hazards Commission, formerly the Earthquake Commission (EQC), is the government-owned insurer that sits underneath private home insurance.
For earthquakes, landslides, volcanic activity, and tsunamis, it covers a dwelling’s building to generally NZ$300,000 plus GST (Goods and Services Tax), New Zealand’s sales tax equivalent.
For storm and flood, it covers land only. So landslip damage to the building has a public backstop, while flood damage falls to private insurers. The Treasury’s Cabinet paper also proposes lifting the Natural Hazards levy, the charge on home insurance that funds the Commission, from NZ$554 to NZ$828 per dwelling.
Four. Know which lender you’re in front of.
According to a 2021 guide by broker Lateral Partners, traditional main-bank development lending required a minimum 25% development margin alongside 30% equity, whereas non-bank hurdles sat at 20% or more. Against these benchmarks, the modeled Scenario A never qualified as bankable “main-bank paper,” even before the policy change.
The Reserve Bank raised the Official Cash Rate, its benchmark policy rate and roughly equivalent to the Federal Reserve’s federal funds rate, by 25 basis points to 2.75% on September 2, 2026. It has also told banks to scrutinize the ongoing insurability of what they lend against. If a lender cuts loan-to-cost to 55%, the modeled project needs NZ$1,829,877 more equity than Scenario A.
Five. Don’t underwrite the statutory clock.
Non-notified resource consent applications maintain a 20-working-day statutory processing timeframe under the Resource Management Act, but the clock stops whenever the council asks for more information. Auckland reports about 15,000 resource consents per year, with 80% processed within statutory timeframes and 98% approved. But how councils handle information requests will soon shift dramatically if a property is exposed to any of the seven covered natural hazards, per planners at Davis Ogilvie.
Strategic Implications
The council applies the national matrix. The insurer applies its own model.
The insurer Tower says it prices earthquake, flood, sea surge, and landslide risk property by property, not by area averages. Since July 1, 2026, its hazard data has appeared in Westpac New Zealand’s banking app when you request an insurance quote.
Cotality sells a flood score for every address to lenders and insurers, but its product page publishes no model date and no methodology. The Natural Hazards Commission’s public portal lets anyone look up claims nationally, while its hazard maps cover only the Bay of Plenty region. The new national hazards policy asks everyone to rely on the best available information. Right now, that’s three private ratings and one statutory matrix, none of them reconciled.
Does a levee, or stopbank, make the question go away? No.
Ruth Feist of Hayson Knell, writing for Property Council New Zealand, the industry group for commercial property owners, says consent applications must include an assessment of residual risk and how to manage it. (Residual risk is what remains after the defense is built.) She adds that premiums in protected, or defended, areas will be affected. A site behind a defense still needs its own evidence.
The market hasn’t decided either. The same Cotality research that found the Mount Albert discount also found that flood-impacted Auckland zones grew 18.4% in value since 2020, against 13% in nearby buffer zones. Its chief data officer, Craig Dargusch, put it this way. Affordability wins today, but risk shapes tomorrow.
This tells me there’s an opportunity in the cost. The rating the council, lender, and insurer all trust will decide which sites are financeable. A developer who commissions the assessment first, designs the floor level in, and hands the lender and the insurer the same evidence the council saw is selling certainty, and certainty is scarce.
Takeaway
The new hazards rule isn’t the real risk. In our modeled scenario, complying with it costs about 7.4 percentage points of margin, and most of that is concrete, not consultants. The bigger risk is the exit. A flood rating can move the sale price more than the rule’s compliance costs combined.
As always, KNOW YOUR SIGNALS and BE CLIMATE READY!
Jamie
Run this on your own deal
The CRDF Deal Stress Test™ built for this brief lets you run your own site through the risk assessment, floor raising, consent delay, the exit discount, and the lender’s leverage, with every input flagged so you can replace it with your own numbers. Free, no signup: Brief 44_CRDF Deal Stress Test™ (xlsx)
New to the framework? The blank master CRDF Signal Tracker™ and Deal Stress Test™ workbooks are at climatereadyre.com/tools.
Related briefs
Same signal (S9 Zoning, Codes & Land Use):
Next in sequence:
Brief 45 · Property Cat Bonds: Inside the $65.6B Market - coming soon
Sources
Every figure above includes the data coverage date, the publication date, and the date I verified it.
The hazards rule — the National Policy Statement for Natural Hazards 2025 was gazetted on December 18, 2025 and came into force on January 15, 2026.
New Zealand Gazette — Notice of National Policy Statement for Natural Hazards 2025, notice 2025-sl7045 (Dame Alcyion Cynthia Kiro, Governor-General) · Data as of in force Jan 15, 2026 · Published Dec 18, 2025 · Accessed Sep 2026
The issuing instrument. A regulatory adoption date, not a data point.
The seven hazards — flooding, landslips, coastal erosion, coastal inundation, active faults, liquefaction, and tsunami.
MfE — NPS-NH Implementation Guide · Data as of Apr 2026 · Published Apr 2026 · Accessed Sep 2026
The list is in the implementation guide, not the regulatory impact statement.
The risk matrix uses seven likelihood bands—from almost certain (10% or greater annual chance) to very rare (less than 0.02%)—crossed with consequence to produce low, medium, high, or very high risk.
MfE — NPS-NH Implementation Guide, Table 1 · Data as of Apr 2026 · Published Apr 2026 · Accessed Sep 2026
Guidance on applying the matrix. Councils make the rating on each application.
Policies 3 and 6 — Policy 3 requires very high-risk development to be avoided, and Policy 6 requires climate impacts to at least 100 years to be considered. Wynn Williams notes councils must consider the hazards rule in resource consent decisions.
MfE — NPS-NH Implementation Guide (verbatim policy text); Wynn Williams (Mike Doesburg, Elliot Massen, Emma Tod) · Data as of in force from Jan 15, 2026 · Published Apr 2026; Wynn Williams Apr 14, 2026 · Accessed Sep 2026
Policy text quoted from the guide. The law firm is cited for the consenting point.
The new planning system — the bills that replace the Resource Management Act passed their third reading, with royal assent to follow and the full system intended to be operating by 2030.
Resource Management Law Association (RMLA), Ross Holden - RMA replacement Bills pass third reading · Data as of Sep 24, 2026 · Published Sep 24, 2026 · Accessed Sep 2026
Royal assent was pending at the time of writing. A professional body relaying the parliamentary stage.
The 2023 losses — extreme weather events cost NZ$9 billion to NZ$14.5 billion, private insurers paid about NZ$4 billion, and the shortfall was NZ$5 billion to NZ$10.5 billion, according to the Treasury.
MfE — Regulatory Impact Statement: NPS for Natural Hazards, p.7 (citing The Treasury) · Data as of 2023 events · Published Nov 14, 2025 · Accessed Sep 2026
A historical event reported in a 2025 regulatory document.
Present-day flood exposure — about 675,000 people living in inland flood hazard areas and an estimated 411,500 buildings exposed.
Ministry for the Environment - National Climate Change Risk Assessment for Aotearoa New Zealand: Main report (AECOM-led consortium with Tonkin + Taylor, NIWA and Latitude) · Data as of present day as at 2019 to 2020 · Published Aug 2020 · Accessed Sep 2026
Present-day exposure from published research, not a projection.
The risk assessment — a quantified natural hazard risk assessment could cost more than NZ$100,000 for multiple sites.
MfE — Regulatory Impact Statement, p.29 · Data as of 2025 estimate · Published Nov 14, 2025 · Accessed Sep 2026
The statement says such an assessment may be required and could cost this much. It does not say every consent incurs it.
Floor raising — raising the floor of a standard dwelling for flood risk costs NZ$20,000 to between NZ$50,000 and NZ$120,000, stated as the total cost, not the marginal cost.
MfE — Regulatory Impact Statement, p.30 · Data as of 2025 literature review · Published Nov 14, 2025 · Accessed Sep 2026
Treating it as fully additional is the model’s assumption and overstates the hit by an amount no source bounds.
The interim estimate — most regulated parties would face marginal costs, if any, not likely to exceed NZ$10,000.
Ministry for the Environment - Interim Regulatory Impact Statement: National Policy Statement for Natural Hazards · Data as of Apr 2025 estimate · Published Apr 23, 2025 · Accessed Sep 2026
An interim statement for a discussion document. The final instrument differs.
Build cost — an Auckland average value of work of NZ$3,270 per square meter and an average consented floor area of 139 square meters.
interest.co.nz (Greg Ninness) — More new homes being consented with build costs remaining relatively flat; and the Auckland residential building consent analysis table, quarter 2026Q1 · Data as of Q1 2026 · Published May 12, 2026 · Accessed Sep 2026
Consented values are estimates lodged at consent and sit below delivered cost.
Henderson house values — an average house value of NZ$862,700 and an estimated yield of 3.6%.
Opes Partners — Henderson House Prices · Data as of Apr 16, 2026 · Published Apr 16, 2026 · Accessed Sep 2026
An all-dwelling average, not a new-build townhouse price.
Development finance terms — non-bank development lending at 9.5% and above plus fees, with a line fee of 1.2% per year on the limit.
Simpler — Development finance NZ · Data as of Jul 14, 2026 · Published Jul 14, 2026 · Accessed Sep 2026
A broker page. The modeled 65% loan-to-cost sits inside its published range.
The flood discount — upfront discounts of NZ$70,000 to NZ$100,000 on flood-susceptible Mount Albert homes, and flood-impacted Auckland zones up 18.4% in value since 2020 against 13% in buffer zones.
Cotality New Zealand via Building Today — Flood-prone property: affordability trumps climate risk fears (Craig Dargusch, chief data officer) · Data as of since 2020, reported Jul 2026 · Published Jul 7, 2026 · Accessed Sep 2026
A relay of Cotality research. Mount Albert is not in West Auckland, so applying the discount to Henderson assumes it is.
The 2024 flood loadings — about 20% of quotes for high flood risk properties carried flood loadings of NZ$250 or more per year.
Reserve Bank of New Zealand — Financial Stability Report May 2024, special topic: insurance availability and risk-based pricing · Data as of 2024 · Published Apr 29, 2024 · Accessed Sep 2026
The baseline for the Treasury collection that followed.
The 2025 flood pricing — just under half of quotes in high flood risk locations carried significant flood pricing, and the largest estimated flood premium was NZ$9,250 against NZ$4,250 in the previous collection.
The Treasury (NZ), prepared by Finity Consulting Pty Ltd (Simon Young, Principal; Sarah Herbert; Phoebe Donaldson) — Insurance Data Collection, p.3, p.25, p.28, p.33 · Data as of Nov 2025 collection · Published Feb 2026 (Nov 2025 collection) · Accessed Sep 2026
The largest premium observed is a maximum, not a typical figure.
The public backstop — building cover generally to NZ$300,000 plus GST for earthquake, landslide, volcanic activity, and tsunami, and land cover only for storm and flood.
Natural Hazards Commission Toka Tu Ake — About NHCover · Data as of cover terms in force 2026 · Published undated (terms checked Sep 22, 2026) · Accessed Sep 2026
Landslip damage to a building is covered. Flood damage to a building is not.
Lender hurdles — main banks required a 25% development margin with 30% equity, and non-banks 20% or more.
Lateral Partners (Ben Pauley) — My development is bankable: who will fund it? · Data as of Dec 2021 · Published Dec 8, 2021 · Accessed Sep 2026
A 2021 broker guide. Current hurdles may differ.
The cash rate — the Official Cash Rate raised by 25 basis points to 2.75% on September 2, 2026.
Reserve Bank of New Zealand — OCR increased by 25 basis points to 2.75% · Data as of Sep 2, 2026 · Published Sep 2, 2026 · Accessed Sep 2026
Money is being priced into a tightening cycle, so the modeled 9.5% development rate is a floor.
The deal scenario — twenty townhouses on a 2,000 square meter brownfield site in Henderson, West Auckland, built to sell at NZ$862,700 per unit; land NZ$2,588,100; build NZ$3,270 per square meter over 139 square meters; development contributions NZ$20,000 per unit and a NZ$12,000 consent deposit; 9.5% at 65% loan-to-cost with a 2% establishment fee and a 1.2% per year line fee; six months before construction and eighteen months of build; Scenario A, Scenario B at the low, mid, and high floor-raising figures, Scenario C with the NZ$70,000 exit discount, and sale price sensitivities including NZ$800,750.
CRREI modeled scenario · Method: one build-to-sell program costed before and after the hazards rule, adding the risk assessment, the consenting delay, and floor raising one factor at a time, with profit as gross development value minus total cost · Modeled — not a specific asset
The land value is rebuilt from three suburb-average houses, which is an assumption. Floor raising is treated as fully additional, which overstates the hit. No land write-down is modeled for a failed site, because no source quantifies one.
Commentary and analysis only. Not investment, financial, legal, tax, or professional advice. CRDF tools are illustrative; examples are composites drawn from public data. Do your own due diligence and consult qualified professionals.
I run this analysis on specific deals. If you are pricing a New Zealand site before consent, book 20 minutes.
Jamie Wolf, MBA — Founder & Publisher, Climate-Ready Real Estate Investing, © 2026, CR REI Holdings LLC