

Signals: S10 Migration & Demographic Shift · S9 Zoning, Codes & Land Use · S11 Public Finance & Infrastructure Capacity
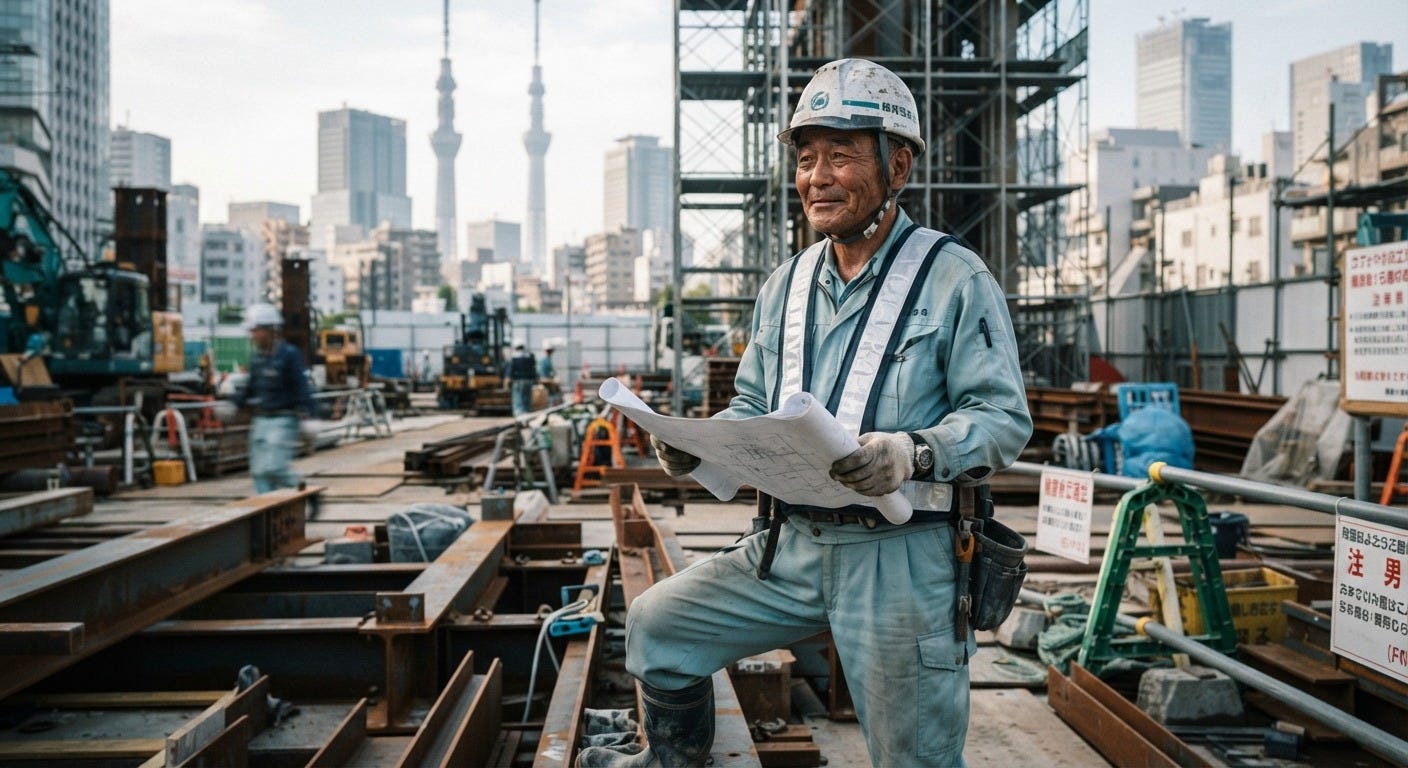
In Monday’s Brief 49, decades of community water conservation in Las Vegas built a cushion, and we found that the moat has depth. Today the moat isn’t water in a reservoir. It’s local crews who can strengthen a building before an earthquake and repair it after.
So for the owner of a 1970s warehouse on Osaka Bay, does a capped, shrinking workforce change the choice between retrofitting and rebuilding?
Market Signal
An earthquake is not a climate hazard, and we don’t count it as climate evidence. It belongs in this series because Japan is the clearest case we’ve found of a community’s labor supply setting the price of resilience, and that’s the risk we’re underwriting today.
On September 26, 2025, the government’s Earthquake Research Committee replaced its 30-year probability for a Nankai Trough megaquake, about 80%, with two model-based ranges: 60% to 90% or higher, and 20% to 50%. The Japan Meteorological Agency’s Osaka office says this reflects a review of calculation methods, not a sudden rise in danger.
The Cabinet Office’s maximum-class estimate, published in March 2025 and modeled by the government, puts the worst case at up to about 298,000 deaths, about 2.35 million buildings destroyed or burnt, and about ¥224.9 trillion in asset damage, across 31 prefectures. That’s a national figure, not one specific to Osaka.
Japan’s Ministry of Land, Infrastructure, Transport and Tourism (MLIT), working from the national labor force survey, counted 6.85 million people employed in construction in 1997. MLIT’s Chubu regional bureau puts the count at 4.78 million in 2025, about 30% lower—skilled workers number 2.96 million, down about 35% from 4.55 million in 1997. And the crew is older. In 2024, 36.7% were aged 55 or over, and only 11.7% were 29 or under.
Since April 1, 2024, Japan’s overtime caps apply to construction. In principle, that’s 45 hours per month and 360 hours per year. Under special agreements, the ceiling is 720 hours per year, under 100 hours in any month (including holiday work), and an average of 80 overtime hours over two to six months.
Notably, Japan’s labor ministry exempts disaster recovery and reconstruction from the 100-hour monthly limit and the 80-hour average. So after a quake, the monthly caps are partly lifted for rebuilding. Before a quake, they aren’t, and preventive retrofit has to happen beforehand.
The crews are also moving to a five-day week. The Japan Federation of Construction Contractors, known as Nikkenren, reports that in the first half of fiscal 2025, 57.4% of building sites closed eight or more days every four weeks, up from 49.3% a year earlier. Those are large general contractors’ own sites, not the whole industry. Fewer working days on a site means a longer schedule for the same work.
Deal Scenario
Let’s look at a modeled scenario, meaning the numbers are not pulled from an actual deal. The asset is a multi-story logistics warehouse of 20,000 square meters on the Osaka Bay waterfront, built in 1975 under Japan’s pre-1981 seismic standard and fully let. In Japan, floor area is priced in tsubo (about 3.3 square meters each), so this building is about 6,050 tsubo.
The owner has three choices.
Option A retrofits in place, with the building half occupied during the work.
Option B demolishes and rebuilds.
Option C holds and does nothing for now.
Japan amended its Construction Business Act in June 2024, and MLIT says the amended law has been fully in force since December 12, 2025. It extends the ban to contractors and owners on significantly short schedules and unjustly low prices, safeguarding both labor conditions and operational feasibility. It creates a mechanism to adjust the contract price when material costs spike during the required contract term. It also requires private owners only to make best efforts to negotiate in good faith, while public owners have a firm duty.
Notice what the Act doesn’t do.
It bans contracting a very short schedule, but it doesn’t assign cost escalation to the owner. In our modeled scenario, we assume the owner bears escalation on half the contract value for any extra months. That’s our assumption, an interpretation of what a required price-change clause plus a banned short schedule does in practice. And it’s enforced. MLIT’s Chubu bureau reports 164 inspector investigations in fiscal 2025.
Now the inputs. For the retrofit, we use ¥62,700 per square meter, the top of MLIT’s fiscal 2024 subsidy-eligible unit cost for buildings at high risk of collapse. It’s a cost reference, not a market quote. The national retrofit program also doesn’t list warehouses as an eligible use. It names commercial facilities, hotels, offices, factories, and similar buildings. Anyone checking Osaka City’s own program would need to ask the city, so we model no subsidy.
For the rebuild, we use ¥840,000 per tsubo. That’s the fiscal 2025 planned average price for steel-frame warehouses started in Osaka, from MLIT’s building starts statistics as tabulated by Nomura Real Estate Solutions. It excludes demolition, which understates rebuild costs.
We assume rent on the existing building is ¥4,000 per tsubo per month. The rebuilt building earns ¥4,390 per tsubo per month, the effective rent for large multi-tenant warehouses in the Kinki region around Osaka in the second quarter of 2026, according to CBRE, as reported by the trade paper LNEWS. Kinki vacancy was just 2.4%, so this market is tight.
Our other assumptions are a 12-month retrofit and a 24-month rebuild; half the rent is lost during the retrofit and all of it during the rebuild; and escalation at 5% per year, the low end of the 5% to 6% annual index rise Nomura reports.
In our modeled scenario, the retrofit costs ¥1.254 billion in work plus ¥145.2 million in lost rent, about ¥1.40 billion in total.
The rebuild costs ¥5.082 billion plus ¥580.8 million in lost rent, about ¥5.66 billion.
The gap between retrofit and rebuild costs is about ¥4.26 billion before labor.
Underwriting Analysis
Test one. How far a labor squeeze stretches the schedule. Each stretch in this test compares the same site before and after it moves to five-day weeks, meaning eight closures every four weeks and 20 working days. The five-day version of the job is slower. A site that closes six days in every four weeks works 22 days. In the US, that's two five-day weeks and two six-day weeks per month. Move it to five-day weeks, and the same work takes 22/20, or 1.10x as long. That’s our illustration. A site with seven closures works 21 days, so the same work takes 1.05x as long. Flip it around, and a six-day schedule finishes the job in 20 divided by 24, or about 0.83x the time a five-day schedule takes. A site that works six-day weeks every week, with only four closures, gives up four working days when it moves to five-day weeks, so the same job takes 1.20x as long. That’s the ceiling we model, and it applies to about 10% of building sites. Weighted across Nikkenren’s building sites, the average stretch is about 1.05x.
Test two. What the stretch costs. In our modeled 1.10x scenario, with a capped 5-day workweek, the retrofit runs 13.2 months instead of 12, and its cost rises by ¥17.7 million due to lost rent and escalation. The rebuild runs 26.4 months instead of 24, and its cost rises by ¥83.5 million. The rebuild absorbs 4.73 times the retrofit’s hit, because it runs twice as long, loses all its rent while it runs, and carries a bigger contract. So labor tilts the choice toward retrofit.
But look at the size. The stretch widens the gap by ¥65.8 million, about 1.5% of it. Even at the 1.20x ceiling, the widening is ¥131.7 million; at the weighted average, it’s ¥33.5 million. Labor is the tilt, not the lever.
Test three. What sets the gap. Construction cost does. Price the rebuild at Osaka’s reinforced-concrete warehouse figure, ¥1.53 million per tsubo, and the gap at 1.10x is about ¥8.5 billion in our modeled scenario. Using a 2022 broker range rolled forward at an assumed 5% per year, about ¥669,000 per tsubo, the gap’s about ¥3.3 billion. That’s a ¥5.2 billion swing compared to about ¥99 million across the whole range of schedule stretches. Rebuild cost is the most sensitive input in this model.
Test four. Who bears escalation? If the owner carried escalation on the whole contract rather than half, the widening would be ¥88.1 million at 1.10x instead of ¥65.8 million. No single assumption moves the widening more, and it’s still small next to the gap.
Test five. Does the rebuild’s rent premium pay for it? In our modeled scenario, the rebuilt building’s ¥4,390 is a 9.75% premium over the ¥4,000 we assume for the old one. With an assumed 85% margin, net operating income rises by ¥24.1 million per year. Recovering the ¥4.26 billion gap from that alone takes about 177 years before discounting. The rent premium doesn’t pay for a rebuild.
Test six. Value and the hold. Valued at 4.2%, the Japan Real Estate Institute’s expected cap rate for multi-tenant logistics at Osaka Port, the rebuilt building is worth ¥6.45 billion in our modeled scenario, or about ¥787 million net of the rebuild’s cost. At an assumed 4.5% cap rate, the retrofitted building is worth ¥5.49 billion, or about ¥4.09 billion net of the retrofit. For Option C, the retrofit costs 25.5% of the building’s value. Holding is rational only if buyers and lenders discount the unretrofitted building by less than that, and only until one of them asks for seismic evidence the building can’t show.
This model ignores the remaining life of a 1975 building after a retrofit compared with a new one. That isn’t modeled, and it’s the real case for a rebuild. If your building has little useful life left, or the wrong floor heights for today’s tenants, the answer can change.
Strategic Implications
Here the moat is the local construction workforce, and it’s draining. There are fewer workers, they’re older, and each one has fewer legal hours.
First, you’re competing for the same crews as the rest of the economy. Nomura reported in July 2025 that electrical contractors’ backlogs ran about 1.6 times pre-pandemic levels, and it tied that to semiconductor plant and data center construction. A warehouse retrofit draws on the same shrinking pool of skilled workers.
Second, labor now has a public price. MLIT raised its public works design labor rate by 4.5% from March 2026, its fourteenth consecutive increase, and a contractor can point to that number in a negotiation. Nomura also reports that actual construction prices run 8 to 9 points above the index, and some large projects reach 1.5 to 2 times their original budgets.
Third, read the contract as a risk transfer. A short schedule can’t be bought, so model the escalation share you’ll actually carry.
Looking ahead, I anticipate that owners of pre-1981 stock who commit crews early will finish first and keep their buyer pool. In a tight Osaka market, a modern box rents at a premium, but that premium is small next to what a new box costs. So retrofit first is the default, and a rebuild has to be justified by remaining life and use, not by rent.
Takeaway
Price the crew, not just the concrete.
In our modeled scenario, labor tilts the choice toward retrofit by about 1.5% of the gap, construction cost sets the gap, and the rebuild’s rent premium doesn’t pay for it.
So remember three things. First, put labor days and the closure calendar into your schedule, and run retrofit against rebuild with the stretch on. Second, get a contractor’s quote for the rebuild before you trust any gap, because construction cost decides it. And third, if you’re counting on a subsidy for a warehouse, ask the city before you underwrite it.
As always, KNOW YOUR SIGNALS and BE CLIMATE READY!
Jamie
Run this on your own deal
The CRDF Deal Stress Test™ built for this brief lets you run your own building through the three options, the stretch ladder, the escalation share, and the rebuild cost band, with every input flagged so you can replace it with your own numbers. Free, no signup: Brief 50_CRDF Deal Stress Test™ (xlx)
New to the framework? The blank master CRDF Signal Tracker™ and Deal Stress Test™ workbooks are at climatereadyre.com/tools.
Related briefs
Same signal (S10 Migration & Demographic Shift):
Next in sequence:
Brief 51 · Copenhagen Cloudburst Cuts: Long-Term Climate Risk Impact - coming soon
Sources
Every figure above includes the data coverage date, the publication date, and the date I verified it.
The quake probability — the Nankai Trough 30-year probability of about 80% replaced by 60% to 90% or higher and 20% to 50%, from two models.
Japan Meteorological Agency, Osaka office, Earthquake memo No. 244 (Earthquake Research Committee revision) · Data as of Sep 26, 2025 · Published Sep 2025 · Accessed Oct 2026
A change in calculation methods, not a sudden rise in danger. An earthquake is not a climate hazard.
The worst case — up to about 298,000 deaths, about 2.35 million buildings destroyed or burnt, and about ¥224.9 trillion in asset damage, across 31 prefectures.
Cabinet Office, 2026 White Paper on Disaster Management, special feature chapter 2 · Data as of Maximum-class estimate · Published 2026 · Accessed Oct 2026
A government model of the maximum-class event, and a national figure, not one specific to Osaka.
The workforce in 1997 — 6.85 million people employed in construction, 4.55 million of them skilled workers.
MLIT presentation on mountain tunnel construction, computed from the MIC Labor Force Survey · Data as of 1997 to 2023 · Published Undated (data through 2023) · Accessed Oct 2026
MLIT’s own computation from the Ministry of Internal Affairs and Communications labor force survey.
The workforce today — 4.78 million employed in construction in 2025, 2.96 million of them skilled workers; 164 investigations by Construction G-men inspectors in fiscal 2025.
MLIT Chubu Regional Development Bureau, presentation on Construction G-men · Data as of 2025 and fiscal 2025 · Published 2026 · Accessed Oct 2026
A regional bureau’s presentation of national figures. The about 30% and about 35% declines are CRREI arithmetic against 1997.
The age profile — in 2024, 36.7% of construction workers were aged 55 or over and 11.7% were 29 or under.
MLIT, material 1-3 to the Cabinet Office regulatory reform working group, from the national labor force survey · Data as of 2024 · Published May 2025 · Accessed Oct 2026
The latest age split found; no 2025 split was published in the sources read.
The overtime caps — from April 1, 2024, 45 hours per month and 360 hours per year in principle; under special agreements 720 hours per year, under 100 hours in any month, and an average of 80 hours over two to six months; disaster recovery and reconstruction exempt from the monthly limits.
Ministry of Health, Labor and Welfare, Annual Health, Labor and Welfare Report, Working Conditions and Labor Relations chapter (English) · Data as of Apr 1, 2024 · Published 2025 · Accessed Oct 2026
The exemption covers disaster recovery and reconstruction, not preventive retrofit.
The five-day week — 57.4% of building sites closed eight or more days every four weeks in the first half of fiscal 2025, up from 49.3% a year earlier; 11.6% closed seven days, 11.6% six days, and about 10% fewer than five.
Japan Federation of Construction Contractors (Nikkenren), fiscal 2025 first-half follow-up report on the five-day-week action plan, page 5 chart · Data as of First half of fiscal 2025 · Published Dec 19, 2025 · Accessed Oct 2026
Large general contractors’ own sites, not the whole industry. The closure shares are read off a chart.
The contracting law — the amended Construction Business Act bans significantly short schedules and unjustly low prices, creates a price-change method for material spikes, and gives private owners a best-efforts duty to negotiate in good faith, with a firm duty for public owners.
MLIT, summary of the 2024 Act amending the Construction Business Act · Data as of Jun 2024 · Published Jun 2024 · Accessed Oct 2026
The Act does not assign cost escalation to the owner. The model’s half-share escalation is an assumption.
Full enforcement — the amended Act fully in force from December 12, 2025, including the ban on contractors agreeing to significantly short schedules.
MLIT, press release on full enforcement of the amended Construction Business Act · Data as of Dec 12, 2025 · Published Nov 14, 2025 · Accessed Oct 2026
Enforcement is by regional inspectors; the 164 investigations are one bureau’s count.
The retrofit cost reference — up to ¥62,700 per square meter for buildings at high risk of collapse; warehouses not listed among eligible uses.
MLIT, housing and building seismic retrofit program, fiscal 2024 supplementary materials · Data as of Fiscal 2024 · Published Fiscal 2024 · Accessed Oct 2026
A subsidy-eligible unit cost, not a market quote. No subsidy is modeled.
The rebuild cost — ¥840,000 per tsubo for steel-frame warehouses and ¥1.53 million for reinforced-concrete warehouses started in Osaka in fiscal 2025; indexes up 5% to 6% per year; actual prices 8 to 9 points above the index; some large projects at 1.5 to 2 times their original budgets.
Nomura Real Estate Solutions, CRE Navi, relaying MLIT Building Starts Statistics · Data as of Fiscal year ended March 2026 · Published Aug 18, 2026 · Accessed Oct 2026
Planned prices at the permit stage, excluding demolition, which understates rebuild cost.
Rents and vacancy — effective rent of ¥4,390 per tsubo per month for large multi-tenant warehouses in Kinki in the second quarter of 2026, with vacancy at 2.4%.
LNEWS, relaying CBRE · Data as of Q2 2026 · Published Aug 18, 2026 · Accessed Oct 2026
A trade paper relaying a broker’s survey.
The cap rate — an expected cap rate of 4.2% for multi-tenant logistics at Osaka Port.
Japan Real Estate Institute, 53rd Japanese Real Estate Investor Survey · Data as of Oct 2025 · Published Nov 2025 · Accessed Oct 2026
An investor survey of expected rates, not transactions.
Competing for crews — electrical contractors’ backlogs at about 1.6 times pre-pandemic levels, tied to semiconductor plant and data center construction.
Nomura Real Estate Solutions, CRE Navi · Data as of 2025 · Published Jul 1, 2025 · Accessed Oct 2026
A real estate services firm’s commentary.
The public price of labor — public works design labor rates up 4.5% from March 2026, the fourteenth consecutive increase.
MLIT, press release on design labor rates applied from March 2026 · Data as of Mar 2026 · Published Feb 17, 2026 · Accessed Oct 2026
A public works rate, which private contracts are not bound to follow.
The deal scenario — a 20,000 square meter (about 6,050 tsubo) 1975 warehouse; retrofit ¥1.254 billion in work plus ¥145.2 million in lost rent, about ¥1.40 billion; rebuild ¥5.082 billion plus ¥580.8 million, about ¥5.66 billion; a gap of about ¥4.26 billion.
CRREI modeled scenario · Method: CRREI arithmetic. Retrofit work is floor area times ¥62,700 per square meter, and rebuild work is tsubo times ¥840,000. Lost rent is months times monthly rent of ¥4,000 per tsubo times the share lost (half for a 12-month retrofit, all for a 24-month rebuild). · Modeled — not a specific asset
A hypothetical building, not a deal. Demolition, subsidies, and the remaining life of the 1975 building.
The stretch ladder and the tests — at 1.10x the retrofit runs 13.2 months and costs ¥17.7 million more, the rebuild 26.4 months and ¥83.5 million more, 4.73 times the retrofit’s hit, widening the gap by ¥65.8 million, about 1.5%; ¥131.7 million at 1.20x and ¥33.5 million at the weighted average of about 1.05x; gaps of about ¥8.5 billion and ¥3.3 billion at ¥1.53 million and about ¥669,000 per tsubo; ¥88.1 million with escalation on the whole contract.
CRREI modeled scenario · Method: CRREI arithmetic. Each step assumes the same site moves to five-day weeks, 20 working days in every four weeks, so the stretch is (working days before ÷ 20). Escalation is contract value times the share exposed times extra months times 5% per year. The ¥669,000 rolls a 2022 broker figure of ¥550,000 per tsubo forward at 5% per year. · Modeled — not a specific asset
A scenario ladder, not a finding. The weighted average uses Nikkenren’s chart shares for its members’ building sites.
The rent premium and the hold — a 9.75% rent premium raising net operating income by ¥24.1 million per year, about 177 years to recover the gap; ¥6.45 billion rebuilt at 4.2%, about ¥787 million net; ¥5.49 billion retrofitted at 4.5%, about ¥4.09 billion net; the retrofit at 25.5% of value.
CRREI modeled scenario · Method: CRREI arithmetic. Net operating income is annual rent times an assumed 85% margin, and value is net operating income divided by the cap rate. · Modeled — not a specific asset
The 4.5% cap rate for the old building and the 85% margin are assumptions. Payback is before discounting.
Commentary and analysis only. Not investment, financial, legal, tax, or professional advice. CRDF tools are illustrative; examples are composites drawn from public data. Do your own due diligence and consult qualified professionals.
I run this analysis on specific deals if you are weighing a seismic retrofit against a rebuild; book 20 minutes.
Jamie Wolf, MBA — Founder & Publisher, Climate-Ready Real Estate Investing, © 2026, CR REI Holdings LLC