

Signals: S2 Credit & Mortgage Markets · S4 Valuation & Appraisal Gap · S1 Insurance Repricing
Spread data is the least negotiable signal in real estate capital markets. A lender either charges more or does not charge more.
Across 556 commercial mortgage-backed securities deals and 40,175 loans, a one-percentage-point increase in the share of a deal’s collateral located in ex-ante flood and sea-level-rise areas is associated with an additional 77 basis points of spread. The comparable coefficient for the share located in ex-post high-risk areas is 56 basis points.
Those are two distinct specifications built on two different hazard measures. They are not the ends of a 56-to-77 range.
Each is an elasticity, not a flat surcharge, which changes how you use it.
Market Signal
The study is the most quantified evidence available on climate risk in commercial mortgage pricing. Yildirim and Zhu matched the Trepp commercial mortgage-backed securities database to FEMA National Risk Index data, covering deals issued between 2011 and 2018 with performance tracked through April 2020.
The headline results are the two elasticities above, each significant at conventional levels. But a second result matters more for structuring.
In deals subject to risk retention, the climate premium is offset. The paper reports a climate-hazard premium of 2.94 basis points per 1% increase in climate hazard being canceled in those deals. That 2.94 basis points is the premium being removed, not a reduced premium that risk-retention deals still pay, and it is not a shrunken version of the 56- and 77-basis-point coefficients.
When the sponsor keeps skin in the deal, the market stops charging for the same underlying hazard. The premium is partly pricing the hazard and partly pricing the incentive to have it underwritten properly. So there are two things to keep top of mind.
First, each figure is an elasticity per percentage point of collateral. A pool with two points more high-risk collateral is not paying a flat 77 basis points more in total. It is paying roughly twice the relevant per-point coefficient. Scale it to your actual concentration, and scale it against the hazard measure that matches your exposure.
Second, the data covers issuance from 2011 to 2018. In other words, it’s eight-plus-year-old data, and much has changed or is moving faster. While strong evidence shows climate exposure was already priced in during that window, it doesn’t measure today’s spread. Anyone quoting a current pool-level differential should be asked where the number comes from.
There is a counter-signal worth holding alongside the elasticities. The hazard measure in that work is the FEMA National Risk Index, which scores expected annual loss at the census-tract level. It is a good but coarse instrument. It does not distinguish between two buildings on the same tract where one sits four feet higher, or where one was built to a hardened specification and the other was not.
A pool-level result built on tract-level hazard therefore prices location and not construction. That is exactly the distinction lenders have been moving toward since, through elevation certificates, physical risk assessments, and insurance carrier counts. Which means the elasticities may understate what a well-documented asset can now argue for, and overstate what a poorly documented one can escape.
The sponsor who can provide evidence of asset-level mitigation is negotiating against a spread set by a tract-level average.
Meanwhile, green-labeled debt is widely described as pricing at a meaningful discount to conventional debt. But does it? Bachmann and Jespersen at Copenhagen Business School examined nearly 50,000 bonds issued from 2015 to 2025 across Europe, North America and China, of which roughly 2,000 carried a green label. The pricing advantage was about 6 basis points in 2015, shrank to statistically zero by 2020, and by 2024 had gone below zero, meaning green issuers paid slightly more than their conventional equivalents.
Green loans are a different instrument from labeled green bonds, and the loan market is where commercial property actually borrows. There, the observed number is small. Reported sustainability-linked loan market practice puts rate adjustments at 5 to 25 basis points, and documented UK mid-market ratchets run 2.5 to 15, with increases when targets are missed. That range reflects reported market practice, not a figure published in the Sustainability-Linked Loan Principles, which are principles-based and set no numeric ratchet. Five to twenty-five is the reported range and 2.5 to 15 the documented one, and both are thin. A seven-year hold model built on a 50 basis point assumption overstates the benefit by a factor of two to twenty against those ranges and isn’t supported by the data.
Case Study
The clearest documented change in commercial mortgage terms is not a spread at all. It is a covenant, and in the United Kingdom the deadline behind it moved this summer.
On June 18, 2026, the UK government published its interim response on Minimum Energy Efficiency Standards (MEES) for the non-domestic private rented sector in England and Wales. The defined target is EPC B by 2031 for buildings over 1,000 square meters, where cost-effective. Buildings below 1,000 square meters remain at EPC E. The previously proposed interim EPC C milestone for 2027 was dropped.
Two things changed at once, and they pull in opposite directions.
The endpoint got stricter. B is a harder standard than C, and meeting it in a 2005-vintage building requires a plant-and-fabric program rather than a lighting swap.
The date moved out by three to four years, and the scope narrowed to larger buildings. A landlord with a 900-square-meter unit is now entirely outside the tightened requirements.
For anyone holding loan documents drafted against the old timetable, this is a live repapering question. Covenant language written to an EPC C obligation landing in 2027 or 2028 now references a requirement that no longer exists. Margin step-ups tied to that date are enforceable as drafted, meaning a borrower can pay a penalty for missing a standard the government withdrew.
The practical sequence is short. Pull the loan documents. Search the covenant language for EPC, energy performance, MEES, sustainability and climate. Note which obligations reference a rating, which reference a date, and which reference the regulations as amended from time to time.
A covenant tied to the statutory minimum as amended tracks the new 2031 position. A covenant tied to a hard-coded EPC C by a hard-coded date does not, and it now sits outside the regime it was written to mirror.
Minimum Energy Efficiency Standards, abbreviated MEES, is a UK regime. The European Union’s Energy Performance of Buildings Directive recast sets its own milestones, and Brief 15 traced what happened in the Netherlands when a national label prohibition took effect.
The instrument differs by jurisdiction. The mechanism does not.
Strategic Implications
Read the covenant, then read the amendment clause. Before any commercial mortgage closing in the UK, the EU, or Australia, run a specific covenant review covering energy performance maintenance obligations, certification conditions attached to refinancing, and physical risk insurance requirements with carrier count floors. Whether the obligation floats with the statute or is frozen at a date is the single most valuable line in the document right now.
Scale the CMBS elasticity to your own concentration. If you are contributing collateral to a conduit, the relevant question is what percentage of the pool is in high-risk areas and how your assets affect that percentage. A sponsor whose contribution moves the pool by half a point is in a different negotiation from one who moves it by three. Use the coefficient that matches the hazard measure in play: 77 basis points per point for ex-ante flood and sea-level-rise exposure, 56 for ex-post high-risk area exposure.
Structure matters as much as hazard. The risk retention finding indicates that the market offsets the climate premium when the originator retains the risk. If you are choosing between execution routes, the spread differential is a structuring variable, not just a regulatory compliance question.
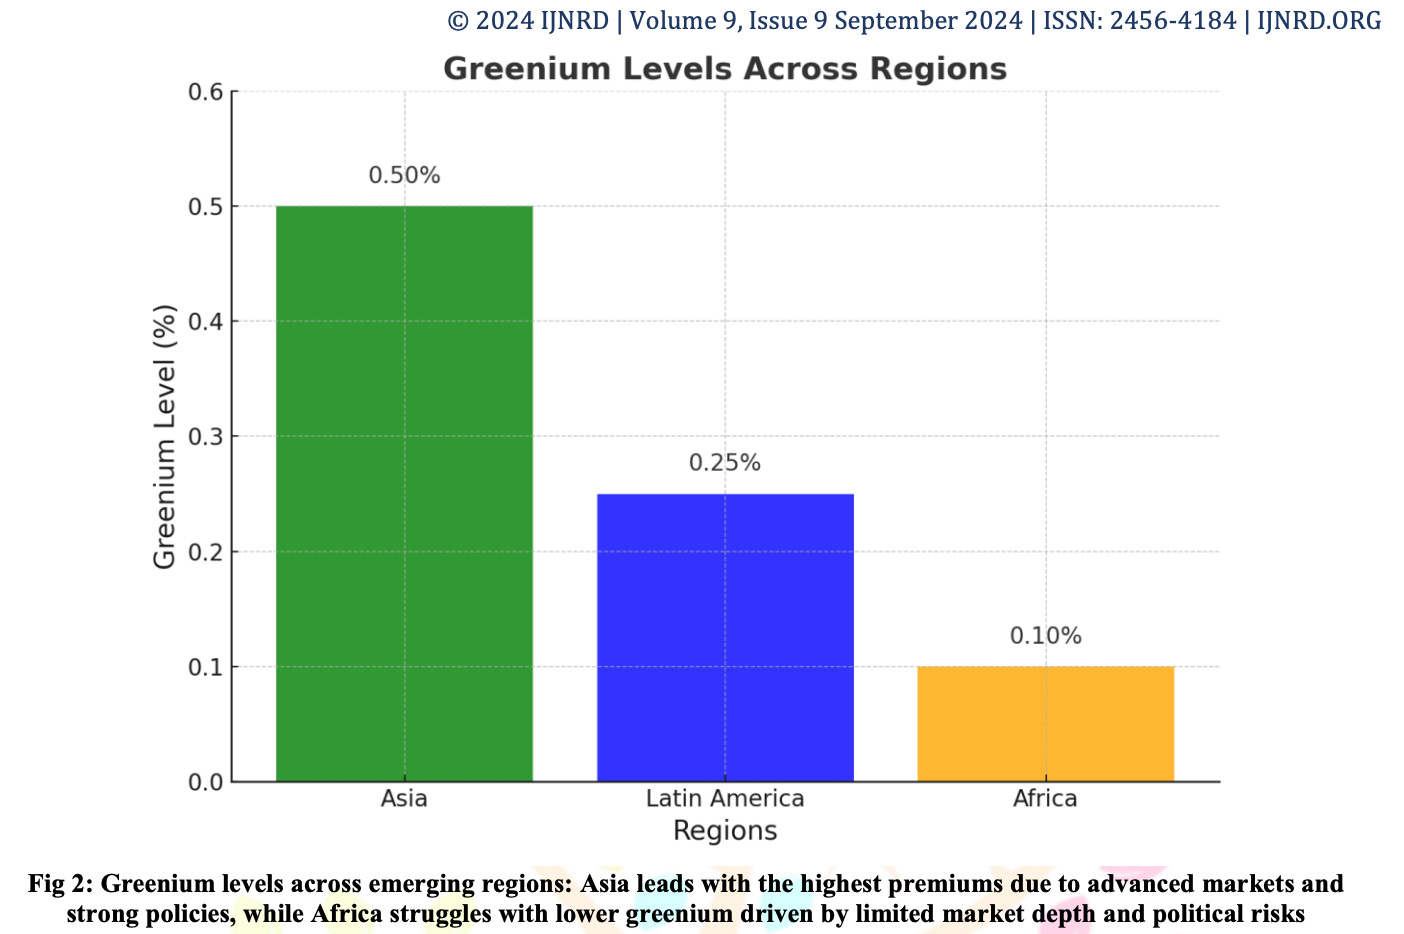
Rebuild any model resting on a 50-basis-point greenium. Nothing supports 50 bps in either instrument, and the two instruments do not carry the same number. On bonds, the advantage was about 6 basis points in 2015, statistically zero by 2020, and below zero by 2024, so green issuers now pay slightly more. On loans, which is where commercial property actually borrows, margin adjustments run 5 to 25 basis points reported and 2.5 to 15 documented in the UK mid-market, and they are two-way ratchets that step up when targets are missed rather than a standing discount. Run the bond case at 6 basis points and at zero. Run the loan case at the bottom of its range and assume the ratchet goes against you. If the deal only works at 50, it is a bet on a spread neither market supports.
Refinancing risk now has a compliance component with a new date. For UK assets over 1,000 square meters with loans maturing after 2031, the refinancing assumption has to include the EPC B position. For loans maturing before then, the 2027 compliance cliff the market was underwriting has receded, which is itself worth repricing.
Future Signal
Regulators are already quantifying climate losses in bank capital, and the numbers are public. The European Central Bank integrated climate risk into the 2025 European Union-wide stress test and published the results on November 19, 2025.
Transition risk reduces common equity tier 1 capital by 74 basis points from 2025 to 2027, with median default probabilities rising by 91% in high-energy-intensity sectors. An extreme flood scenario reduces common equity tier 1 by about 77 basis points.
Scope is relevant here. That analysis covers non-financial corporate loans segmented by energy intensity. It does not treat commercial real estate as a separate asset class. The mechanism to watch is the one that turns capital into price. When a supervisor requires a bank to hold more capital against a category of exposure, the cost of that capital is reflected in the borrower’s spread.
The European Central Bank has now quantified the capital effect. Extending the exercise to commercial real estate specifically is the step that would make the spread effect explicit, and it has not happened yet.
Formal climate tranching remains a forecast. The current differentiation is priced inside conduit spreads rather than expressed in the capital structure. Tranching pools explicitly by climate exposure would make the label permanent for the life of the instrument, which is a materially different thing from a spread that can compress. Nothing in the evidence base says this is imminent. It is the direction the elasticities point.
Private real estate credit is the slowest layer and the least measured. Climate terms have reached institutional mortgage and securitized markets first. Private credit has been slower, and reliable sizing of the private real estate debt market in particular is hard to find. Figures circulating that it is two trillion dollars appear to conflate it with private debt or private credit overall. Treat the direction as sound and the market size as unestablished.
Pull your last three loan documents. Search for EPC, energy performance, MEES, climate, and sustainability. Whether the covenant floats with the statute or is frozen at a withdrawn deadline is your baseline today.
As always, KNOW YOUR SIGNALS and BE CLIMATE READY!
Jamie
Run this on your own deal
The CRDF Signal Tracker™ built for this brief lets you log the debt signals in this piece against your own financing relationships and existing loan documents, translate them into financial impact, and score which ones are moving your pricing. Free, no signup: Brief 22_CRDF Signal Tracker™ (xlsx)
New to the framework? The blank master CRDF Signal Tracker™ and Deal Stress Test™ workbooks are at climatereadyre.com/tools.
Related briefs
Same signal (S2 Credit & Mortgage Markets):
Brief 10 · Bank Lending Criteria and Climate Risk on Property: The New Overlays
Brief 6 · The 30-Year Mortgage and Climate Risk: What the LA Fires Exposed About Loan Duration
Next in sequence:
Brief 23 · EPC Improvement Capex Financing for UK Industrial: EPC B by 2031
Sources
Every figure above, with the date the data covers, the date it was published, and the date I verified it.
CMBS spreads and climate exposure — 77 basis points of additional spread per one percentage point of collateral in ex-ante flood and sea-level-rise areas, and 56 basis points per one percentage point in ex-post high-risk areas: two separate coefficients from different hazard measures, not a range. In risk-retention deals, the climate-hazard premium of 2.94 basis points per 1% increase in climate hazard is offset, not merely reduced. 556 deals, 40,175 loans.
UC Berkeley Haas (WFA 2024 paper archive) — Yildirim & Zhu, working paper on climate risk, risk retention and CMBS · Data as of 2011–2018 issuance, performance to April 2020 · Published Apr 2024 · Accessed Aug 2026
Working paper, not yet peer-reviewed. Built on the Trepp CMBS database matched to FEMA National Risk Index data. Each result is an elasticity per percentage point of collateral, not a flat pool-level differential, and the two coefficients come from different hazard specifications.
UK non-domestic MEES position — EPC B from 2031 for buildings over 1,000 square meters where cost-effective; EPC E retained below 1,000 square meters; the proposed 2027 EPC C milestone dropped.
UK Government — Minimum Energy Efficiency Standards (MEES) in the non-domestic private rented sector: interim response · Data as of Jun 18, 2026 · Published Jun 18, 2026 · Accessed Aug 2026
Existing exemptions and cost-effectiveness tests remain in place. Corroborated by law firm summaries published the same week.
Green bond pricing advantage — about 6 basis points in 2015, shrank to statistically zero by 2020, and by 2024 had gone below zero, meaning green issuers paid slightly more than their conventional equivalents; nearly 50,000 bonds, of which roughly 2,000 were green-labeled.
Nordic ESG Lab, Copenhagen Business School — Bachmann & Jespersen, “No More Greenium: What the Vanishing Green Bond Premium Means for Sustainable Finance” · Data as of 2015–2025 · Published Jul 18, 2025 · Accessed Aug 2026
Covers labeled green bonds in Europe, North America, and China. Green loans are a separate instrument and are sourced separately below. This is also the evidence base against any 50 basis point greenium assumption.
Green and sustainability-linked loan pricing — margin adjustments of 5 to 25 basis points, stepping up when targets are missed.
LSTA — Sustainability-Linked Loan Principles (SLLP) · Data as of 2024–2026 · Published date not stated · Accessed Sep 2026
The Sustainability-Linked Loan Principles are principles-based and state no numeric ratchet range. The 5 to 25 basis point range reflects reported market practice and is not traceable to a figure published in the Principles or in Loan Market Association guidance.
ECB climate stress test results — transition risk reduces common equity tier 1 capital by 74 basis points across 2025 to 2027, with median default probabilities rising 91% in high energy-intensity sectors; an extreme flood scenario reduces common equity tier 1 by about 77 basis points.
European Central Bank — Macroprudential Bulletin: integrating climate risk into the 2025 EU-wide stress test · Data as of 2025–2027 · Published Nov 19, 2025 · Accessed Aug 2026
Covers non-financial corporate loans segmented by energy intensity. Commercial real estate is not treated as a separate asset class in this exercise.
Commentary and analysis only. Not investment, financial, legal, tax, or professional advice. CRDF tools are illustrative; examples are composites drawn from public data. Do your own due diligence and consult qualified professionals.
I run this analysis on specific deals. If you hold UK assets with covenant language written to the withdrawn EPC C deadline and want the refinancing assumption tested before your next maturity, book 20 minutes.
Jamie Wolf, MBA — Founder & Publisher, Climate-Ready Real Estate Investing, © 2026, CR REI Holdings LLC