

Signals: S2 Credit & Mortgage Markets · S1 Insurance Repricing · S4 Valuation & Appraisal Gap
Lenders size a commercial mortgage on net operating income. When the insurance line rises and rent does not follow, the income the lender lends against shrinks, and the loan shrinks with it.
That is how climate data reaches a commercial mortgage today. Not through an announced climate premium on the rate sheet, but through the insurance line, the deductible rules, and the coverage ratio.
The storm shows up in the loan file before it shows up in the price.
Market Signal
A July 2026 working paper by Stefany Burbano and Nils Kok at Maastricht University and Rogier Holtermans at the University of Guelph puts a number on the insurance line. They reviewed 24 hurricanes that made landfall in the United States between 2010 and 2023 and cross-referenced the landfalls against the operating statements of large, institutionally owned commercial properties, measuring insurance as a share of total operating expenses. Across the sample, that share averaged 5.7 percent.
After a hurricane, exposed properties saw the share rise by about 1.2 percentage points nationally — roughly a fifth of the average. In hurricane-prone states, the estimate is about 1.7 points, closer to 30 percent of the average. Where properties took hurricane-force winds, the rise was 5.1 to 9.1 percentage points.
The paper also tested forward-looking hazard scores, and the result is the one underwriters should read twice. A wind score moved insurance costs. A flood score did not. Wind is what the insurance market is pricing, per the authors — although the paper has not been peer-reviewed, and the hazard scores it used were supplied by a commercial vendor.
In the same sample, insurance rose from about 3.0 percent to almost 6.8 percent of total operating expenses between 2017 and 2024, and from about $8,000 to nearly $24,000 per property per year. Scale turns out to be a hedge. Properties run by managers concentrated in one state saw post-storm increases of 2.3 to 2.9 percentage points. Properties with highly diversified managers saw 0.8 to 1.4.
Case Study
The best public numbers are national, so read what follows as national evidence applied to one market — Miami multifamily — rather than as a measured Miami result.
Start with the cost. Minjoo Kim, Prateek Mahajan and Zirui Wang at the University of Texas at Austin, writing for the Brookings Hutchins Center, studied more than 100,000 multifamily properties financed through Freddie Mac and Fannie Mae securitizations. Average growth in insurance costs exceeded 15 percent per year in every year since 2019, and reached nearly 30 percent in 2023. By 2024, insurance was about 9.9 percent of operating expenses, about 8 percent of net operating income and about 18 percent of debt service. Florida sits at the hard end of that range: a Federal Reserve note from September 2025 found per-unit insurance costs in 2024 were much higher in Florida and on the Louisiana and Texas coasts than in most of the country.
To be fair to the market, the latest Florida reading has eased. CRE Daily, reporting Trepp data, says the median insurance cost for securitized Florida apartment buildings fell 6.2 percent in 2025, after a 42.1 percent jump in 2023.
Then ask who pays. On average, the Texas team found about 49 percent of insurance-cost increases showed up in rents. But that response has faded to nothing. In 2014, a 10 percent rise in insurance costs went with a 0.35 percent rise in rent. By 2024, it went with 0.02 percent. The rest comes out of the owner’s income, and the Federal Reserve’s own estimate agrees: a dollar of extra insurance cost cuts apartment owner net income by about 72 cents.
That is counter-intuitive until you name the mechanism. Since 2024, a large supply of new rental apartments has come online, damping rent growth, and landlords face regulatory limits on how much and how often they can raise rents. They absorb the increase.
Buyers have noticed. After 2018, riskier properties sell at lower prices and higher cap rates — for each one-log-point step up in FEMA’s expected building losses, the same property trades about 6.5 percent lower per unit, with a cap rate about 11.8 basis points higher.
Now the lenders. In July 2025, Freddie Mac Multifamily raised the largest named-storm deductible it will accept from 5 percent to 7.5 percent of total insured value, and restated its wind and hail maximum of 5 percent on the same basis. Fannie Mae’s guide sets the same ceilings. HUD had already moved, in April 2024: for new FHA multifamily loans the maximum wind or named-storm deductible went from the greater of $50,000 or 1 percent, capped at $250,000, to the greater of $50,000 or 5 percent per location, capped at $475,000 per occurrence.
Put that on one asset, as an illustration and not a deal. Take a Miami apartment property insured for $40 million. Under Freddie Mac’s ceiling, the borrower can carry up to $3 million of loss per named storm before the insurer pays. Under HUD’s current cap, the same property would carry at most $475,000. That is more than six times the retained loss.
A bigger deductible can bring the premium down. It also moves the first loss onto the borrower’s equity — which is the lender’s cushion. HUD explains its own move differently, saying coverage at the old deductible could be hard to get or “may be unreasonably expensive”, and pointing to “the realities of climate change”.
Strategic Implications
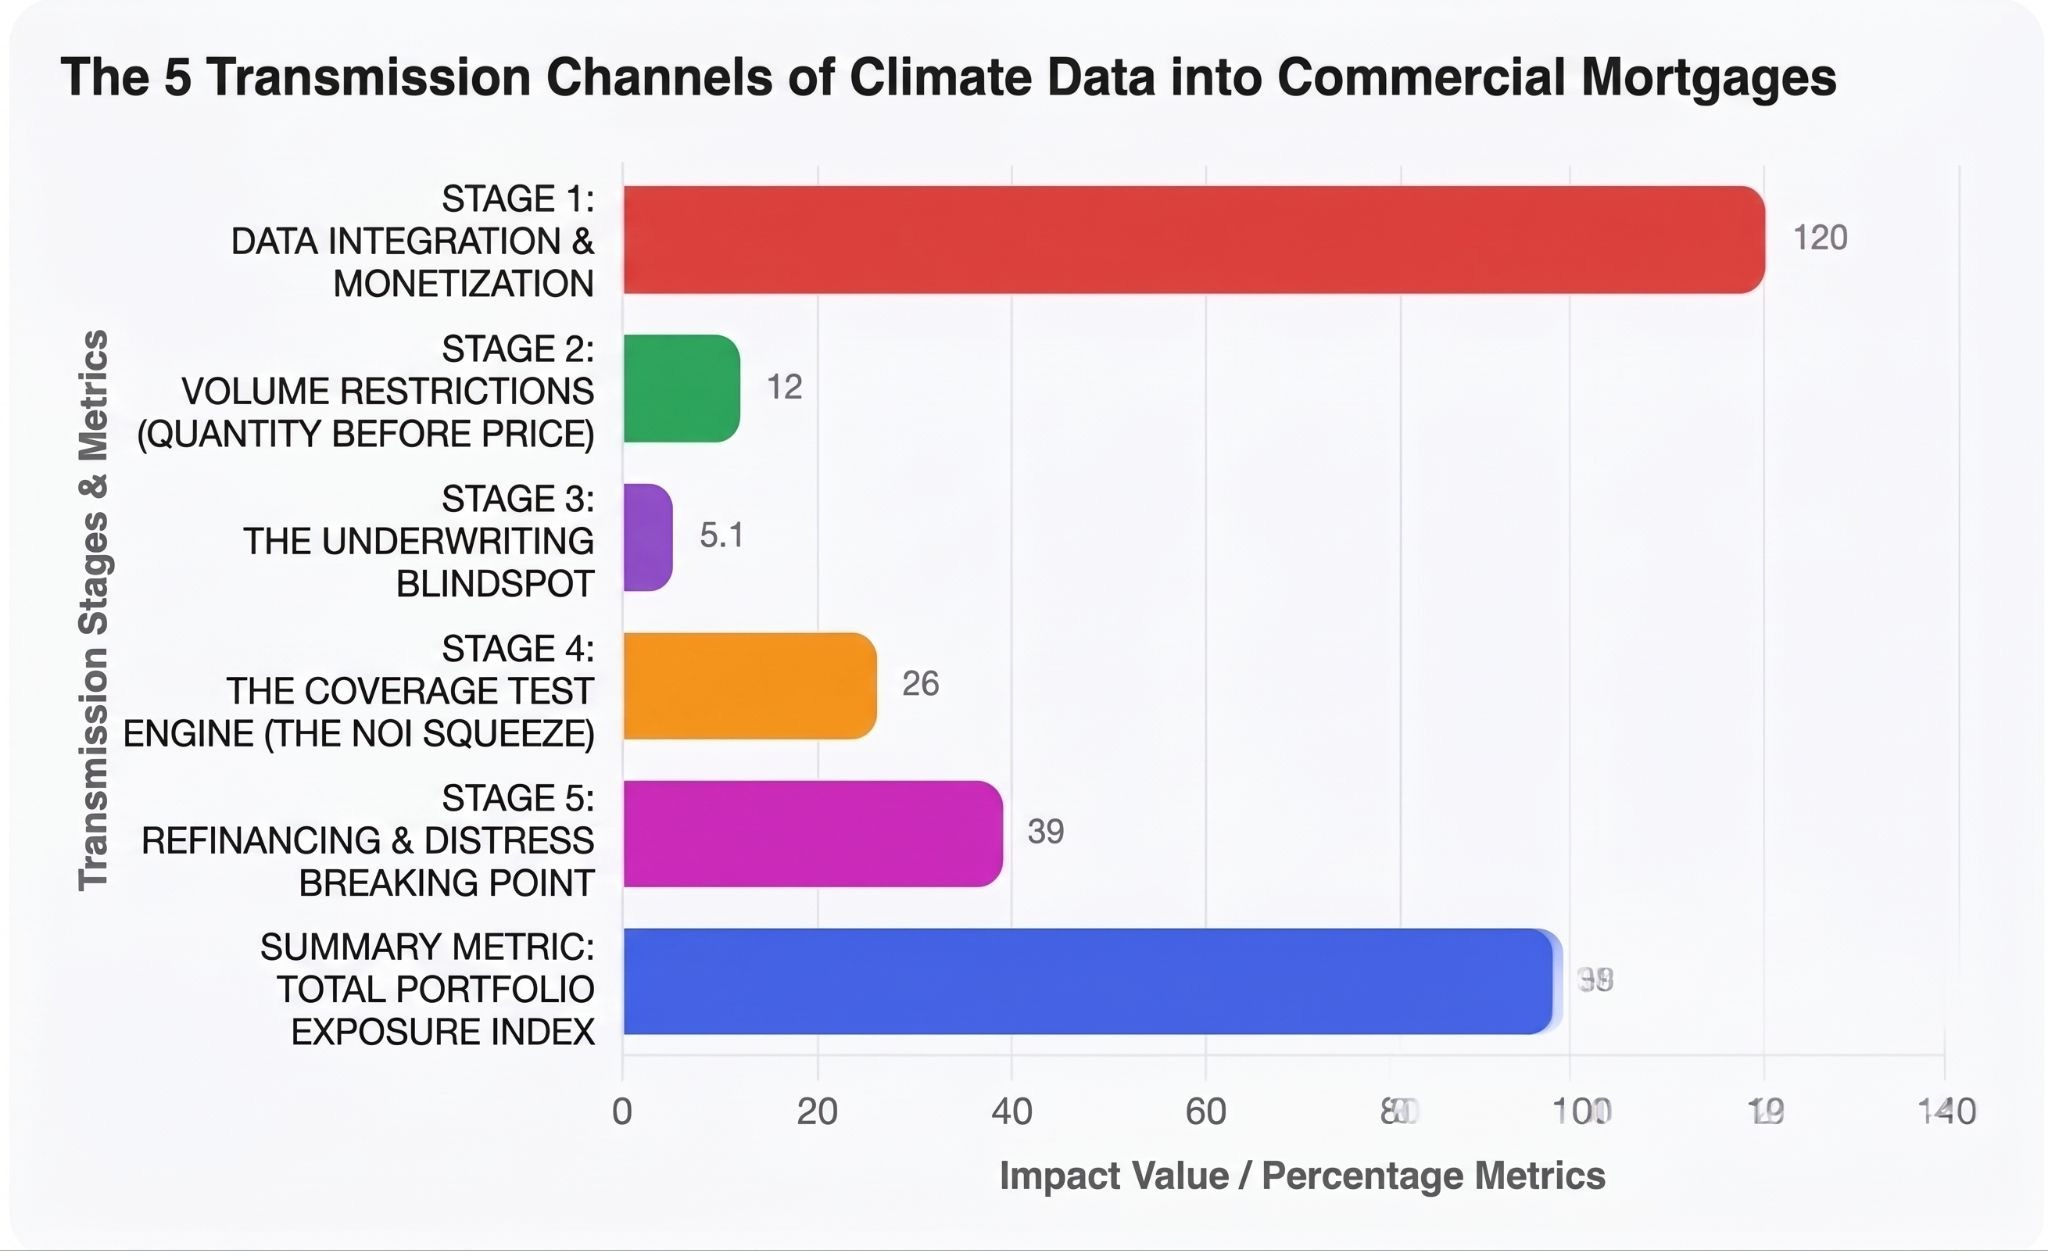
Climate data now reaches the loan in five ways, and all five run through credit and mortgage markets.
The coverage ratio does the pricing. Where insurance cannot be passed to tenants, it comes straight out of NOI, and the loan is sized on NOI. The Texas team estimates the cumulative 2014–2024 effect at about 5.1 percent lower NOI on average, and an implied 26 percent decline at the 95th percentile of insurance-cost growth — a modeled estimate for the hardest-hit tail, not an average. Their data also show higher insurance cost per unit going with a weaker debt coverage ratio. No bank has to announce a climate premium. The coverage test does the work.
Banks told supervisors they lack the deductible data. In the Federal Reserve’s 2024 pilot climate scenario exercise, the six participating banks listed data gaps that included “levels and types of coverage, deductibles and replacement cost values”, and some “used external vendors to run simulations of thousands of potential hurricane events”. The storm model is available. What is missing is the borrower’s insurance schedule.
Lenders move volume before they move price. Ralf Meisenzahl at the Chicago Fed studied the loan books of 35 bank holding companies and found a one standard deviation increase in flood risk reduced commercial real estate lending in the riskier area by about $5 million, or about 12 percent of the sample mean, between 2014 and 2019. That is flood rather than wind, and it measures how much banks hold rather than what they charge.
Coverage failures are already in the distress numbers. Multifamily Dive reported in August that CRED iQ’s founder and chief executive, Michael Haas, pinpointed year-on-year increases of as much as 100 percent in insurance and property tax, which pushed the debt coverage ratio below 1.0X on 39 of the 98 multifamily loans CRED iQ evaluated. That is trade reporting, it combines insurance with tax, and it does not say which loans — but it is the loan-level version of everything above.
Index providers are buying the data. In June 2026, MSCI agreed to buy First Street, the physical climate risk modeler, for a $120 million cash payment at closing, plus possible payments over two years tied to revenue targets. MSCI completed the deal on August 3, and First Street’s data now covers more than 2.4 billion structures.
There is a gap worth naming. We looked for a public study of commercial loan spreads against hurricane exposure and did not find one. What exists points the same way — Holtermans, Kahn and Kok have tied hurricanes to higher commercial mortgage delinquency, and other work ties flood and sea-level exposure to CMBS deal spreads — but nobody has yet published the loan-level rate. The pricing channel is visible in the coverage test and in lending volume, not yet in a measured spread.
Future Signal
Matthew Eby, founder and chief executive of First Street, framed the acquisition this way when MSCI announced it: joining MSCI “puts our property-level science in front of the world’s leading investors, lenders, and insurers, and turns climate risk from a disclosure exercise into a daily input for how capital is priced and allocated.” It is a founder’s statement at sale, and should be read as one. But the direction is not in dispute.
Rich Sorkin, co-founder and chief executive of Jupiter Intelligence, has put his company’s analytics inside JLL’s risk advisory platform so that professionals can, in his words, “quantify physical climate risks with the same rigor they apply to market and credit risk”. And the detail that closes the circle: the Burbano, Holtermans and Kok paper that opens this brief used Jupiter’s hazard scores. That is where the wind-versus-flood result comes from.
At the other end of the chain, CRED iQ tracks more than $2.3 trillion in commercial loans by aggregating property, financial, loan, tenant, and ownership data — which means it can already see the loans where the coverage ratio is breaking.
One more signal sits on the agency side, and it is still only a proposal. HUD has a draft out for public comment that would drop the $475,000 cap it now calls “too restrictive”, keep the 5 percent limit, measure it per building, and require owners to show cash of two to three times the deductible. As of this writing, it has not been finalized as a rule, and you should not plan around it.
The next change is unlikely to be a rate premium announced by a bank. It is a hazard score and an insurance schedule sitting beside the rent roll in every commercial loan file, with the deductible sized to the storm model rather than to a flat percentage.
So underwrite the deductible, not only the premium. Before you refinance a coastal asset, price the retained storm loss the new rules allow. Model NOI with insurance growing and rent not following. And bring the hazard data to your lender before your lender brings it to you.
As always, KNOW YOUR SIGNALS and BE CLIMATE READY!
Jamie
Run this on your own deal
The CRDF Signal Tracker™ built for this brief lets you log four readings in your own markets — the insurance expense ratio, rent pass-through, agency deductible limits, and debt coverage on storm-exposed loans — so you can see the coverage test moving before a lender tells you it has. Free, no signup:: Brief 37_CRDF Signal Tracker™ (xlsx)
New to the framework? The blank master CRDF Signal Tracker™ and Deal Stress Test™ workbooks are at climatereadyre.com/tools.
Related briefs
Same signal (S2 Credit & Mortgage Markets):
Brief 10 · Bank Lending Criteria and Climate Risk on Property: The New Overlays
Brief 6 · The 30-Year Mortgage and Climate Risk: What the LA Fires Exposed About Loan Duration
Next in sequence:
Brief 38 · Climate Data in CRE Underwriting: DSCR & LTV Impact - coming soon
Sources
Every figure above includes the data coverage date, the publication date, and the date I verified it.
Hurricanes and the insurance line — across 24 U.S. hurricane landfalls from 2010 to 2023, insurance as a share of total operating expenses rose about 1.2 percentage points at exposed properties nationally and about 1.7 points in hurricane-prone states, against a sample mean of 5.7 percent; under hurricane-force winds the rise was 5.1 to 9.1 points; a forward-looking wind hazard score moved costs while a flood score did not; and the ratio rose from about 3.0 percent to almost 6.8 percent, and from about $8,000 to nearly $24,000 per property per year, between 2017 and 2024.
Burbano, Holtermans & Kok, “Climate Risk and the Insurability of Commercial Real Estate” (working paper) · Data as of 2010-2024 · Published Jul 26, 2026 · Accessed Sep 2026
A working paper, not peer-reviewed. The hazard scores are Jupiter Intelligence’s, and the hazard-score and floodplain results are cross-sectional rather than event-based. The study cannot separate premium increases from changes in coverage bought.
Insurance cost growth and pass-through in agency multifamily — more than 100,000 Freddie Mac and Fannie Mae securitized multifamily properties; insurance growth above 15 percent per year in every year since 2019 and near 30 percent in 2023; about 9.9 percent of operating expenses, 8 percent of NOI and 18 percent of debt service by 2024; about 49 percent of cost increases reflected in rents on average, with the marginal response falling from 0.35 percent to 0.02 percent per 10 percent cost rise between 2014 and 2024; an implied cumulative NOI decline of about 5.1 percent on average and 26 percent at the 95th percentile of cost growth; and a 6.5 percent lower price per unit with an 11.8 basis point higher cap rate per log point of FEMA expected building losses after 2018.
Kim, Mahajan & Wang, Hutchins Center Working Paper #110, Brookings · Data as of 2010-2024 · Published Jul 2, 2026 · Accessed Sep 2026
Reduced-form associations with property and CBSA-by-year fixed effects, which the authors do not describe as causal. The 26 percent figure is model-implied for the top 5 percent of cost growth and is never an average. Securitized properties are larger and newer than the market as a whole.
Florida per-unit costs and owner income — per-unit apartment insurance costs in 2024 were much higher in Florida and on the Louisiana and Texas coasts than in most of the country, and a dollar of extra insurance cost reduces apartment owner net income by about 72 cents.
Hughes & Molloy, FEDS Notes, Federal Reserve Board · Data as of 2019-2024 · Published Sep 19, 2025 · Accessed Sep 2026
Securitized multifamily only, drawn from Trepp CMBS operating statements. The note gives a geographic ranking, not a per-unit dollar figure for Florida.
The latest Florida reading — the median insurance cost for securitized Florida multifamily fell 6.2 percent year on year in 2025, after a 42.1 percent rise in 2023.
Trepp, TreppTalk — Florida Multifamily Insurance Costs Reverse Course After Years of Outsized Growth · Data as of 2025 · Published Aug 27, 2026 · Accessed Sep 2026
Trepp’s own data, opened and read. Securitized properties, and a median rather than a mean. The turn began in 2024, when Florida’s growth first fell below the rest of the nation. It cuts against the direction of the rest of this brief, which is why it is here.
The agency deductible ceilings — Freddie Mac Multifamily raised its maximum named-storm deductible from 5 percent to 7.5 percent of total insured value and restated its 5 percent wind and hail maximum on the same basis, effective for new loans from July 24, 2025; Fannie Mae’s Multifamily Guide sets the same 7.5 percent and 5 percent ceilings.
Freddie Mac Multifamily, Guide Bulletin M2025-5 and Guide chapter 31 redlines · Data as of 2025-2026 · Published Jul 15, 2025 · Accessed Sep 2026
Adopted, checked September 21, 2026. These are the maximums a lender will accept, not requirements a borrower must meet, and they are nationwide rather than coastal. Fannie Mae’s ceilings were confirmed separately from the live guide.
The HUD FHA deductible cap and its stated reason — for new FHA multifamily transactions from April 17, 2024, the maximum wind or named-storm deductible is the greater of $50,000 or 5 percent of insurable value per location, up to $475,000 per occurrence, replacing the greater of $50,000 or 1 percent capped at $250,000; HUD said coverage at the old level “can be difficult to obtain ... or ... may be unreasonably expensive” and cited “the realities of climate change”. A draft HUD mortgagee letter out for comment would drop the $475,000 cap as “too restrictive”, keep 5 percent measured per building, and require owner liquidity of two to three times the deductible.
HUD FHA Multifamily, Mortgagee Letter 2024-05 and Housing Notice H 2024-6 · Data as of 2024-2026 · Published Apr 17, 2024 · Accessed Sep 2026
Adopted, checked September 21, 2026, and applies to new transactions rather than existing loans at renewal. The draft letter is proposed only, not final in any 2026 mortgagee letter, and must never be stated as a rule.
What the banks told their supervisors — the six banks in the Federal Reserve’s pilot climate scenario analysis exercise listed data gaps including “levels and types of coverage, deductibles and replacement cost values”, and some “used external vendors to run simulations of thousands of potential hurricane events”.
Federal Reserve Board, Pilot Climate Scenario Analysis Exercise insights · Data as of exercise run 2023 · Published May 2024 · Accessed Sep 2026
A completed supervisory exercise, not a rule. Participants are unnamed, and they self-reported the gap rather than supervisors finding it.
Lending volume moves before price — a one standard deviation rise in flood risk reduced commercial real estate lending in the riskier area by about $5 million, about 12 percent of the sample mean, across the books of 35 bank holding companies between 2014 and 2019.
Meisenzahl, Federal Reserve Bank of Chicago, Working Paper 2023-12 · Data as of 2014-2019 · Published Mar 30, 2023 · Accessed Sep 2026
Baseline 2014-2019, and it measures flood rather than wind. It measures the quantity of lending banks retain, not the rate they charge. Bank-county and bank-year fixed effects.
Coverage failures at loan level — rising insurance and property-tax costs, with year-on-year increases of as much as 100 percent, pushed debt service coverage below 1.0X on 39 of the 98 multifamily loans CRED iQ evaluated.
Multifamily Dive (Leslie Shaver), reporting CRED iQ · Data as of 2026 · Published Aug 12, 2026 · Accessed Sep 2026
Trade reporting; no CRED iQ primary was found. It combines insurance with property tax, is not hurricane-specific, and does not define the 98-loan population. The “as much as 100 percent” line is the reporter’s paraphrase of Michael Haas, not a quotation from him, and “as much as” is a maximum. Attributed context only.
The data moves into the pricing stack — MSCI agreed on June 24, 2026, to buy First Street for “a cash payment of $120 million at closing” plus possible payments over two years tied to revenue thresholds, completed the deal on August 3, 2026, and reports First Street data covering more than 2.4 billion structures.
MSCI Inc. press releases · Data as of 2026 · Published Jun 24, 2026 · Accessed Sep 2026
Company releases, and the executive quotation in them is a promotional statement made at the point of sale. The contingent payments are not disclosed as an amount.
Hazard analytics inside an advisory platform — Jupiter Intelligence’s analytics sit inside JLL’s risk advisory platform, and Rich Sorkin says professionals can “quantify physical climate risks with the same rigor they apply to market and credit risk”.
JLL newsroom release (JLL and Jupiter Intelligence) · Data as of 2025 · Published Sep 18, 2025 · Accessed Sep 2026
A promotional company release, and the quotation is attributed to Sorkin rather than to JLL. The bank client it mentions is unnamed, and its figure is not used here.
The Miami deductible illustration — a property insured for $40 million carries up to $3 million of named-storm loss under Freddie Mac’s 7.5 percent ceiling, against at most $475,000 under HUD’s current cap, more than six times the retained loss.
CRREI modeled scenario · Method: the published agency ceilings applied to one illustrative total insured value: 7.5% x $40,000,000 = $3,000,000, against HUD’s $475,000 per-occurrence cap · Modeled — not a specific asset
An illustration, not a deal, and not a Miami measurement. The two ceilings govern different loan programs, so no single borrower faces both. HUD’s cap equals 1.19 percent of this insured value and binds above $9.5 million.
Commentary and analysis only. Not investment, financial, legal, tax, or professional advice. CRDF tools are illustrative; examples are composites drawn from public data. Do your own due diligence and consult qualified professionals.
I run this analysis on specific deals. If you are refinancing a storm-exposed asset and want the retained loss priced before your lender prices it, book 20 minutes.
Jamie Wolf, MBA — Founder & Publisher, Climate-Ready Real Estate Investing, © 2026, CR REI Holdings LLC