

Signals: S4 Valuation & Appraisal Gap · S3 Capital Allocation Flows · S5 Acute Climate Hazard
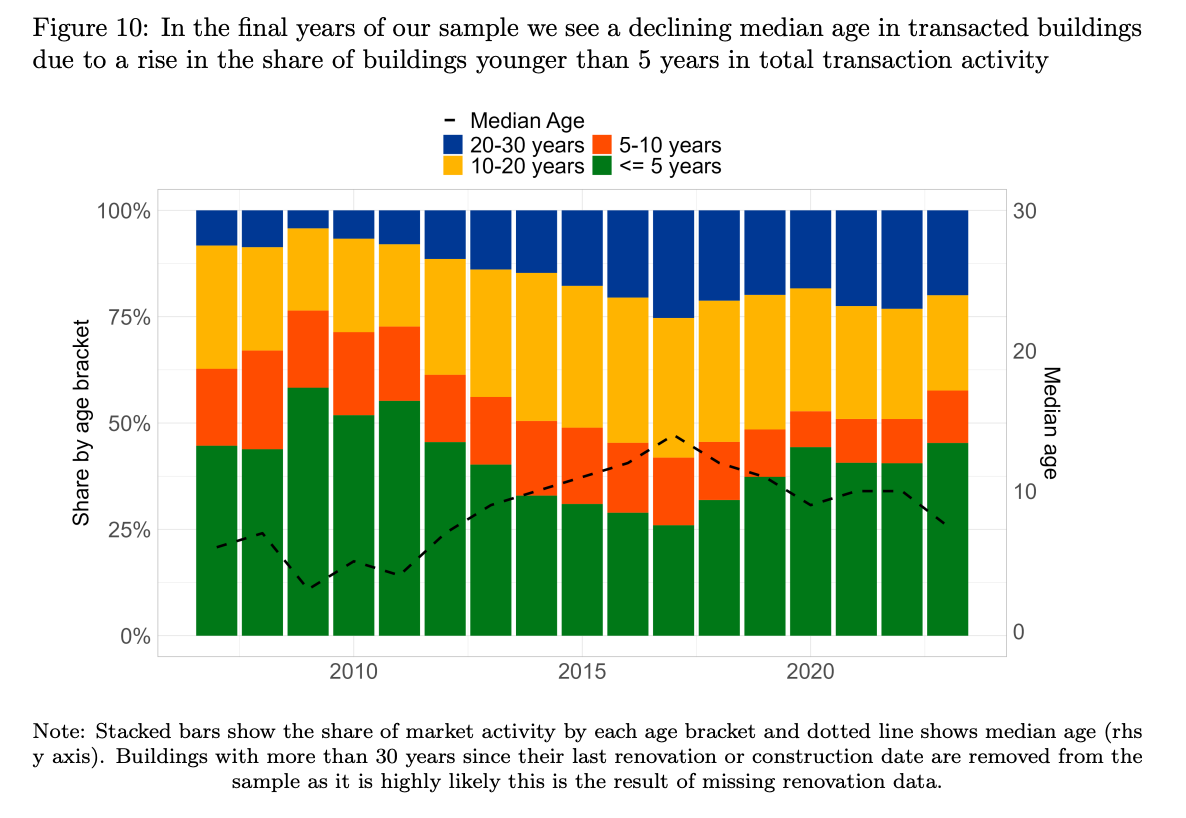
IMAGE CREDIT: https://www.ecb.europa.eu/pub/pdf/scpwps/ecb.wp3059~cf6e65ea31.en.pdf
On Friday, in Johor, a state water test decided which data centers get built. That was a permit. Today we move from permits to prices. The question is whether office buyers in the EU have been repricing climate risk on their own, deal by deal. The European Central Bank went and measured it.
Market Signal
Three authors at the European Central Bank, Kai Foerster, Ellen Ryan and Benedikt Scheid, published Working Paper 3059 in May 2025. They took 24,386 office sales across the Eurozone, plus Bulgaria, and matched each one to a physical climate risk score. These are large office deals, mostly €10 million or more. The deals they examined ran from 2007 to 2023, but the price results stopped in 2022.
The headline said the discount on a high-risk building increased by 24 percentage points between 2007 and 2022. But what does that actually reflect?
High-risk offices actually sold at a small premium in 2007, once you control for location and the local economy. By 2022, that had turned into a discount of about 13 points, roughly 12 percent below comparable offices. So the historical story is a swing from a premium to a discount.
And it wasn’t a straight line. The discount first became consistently significant in 2012. It was deepest in 2013. It was back close to zero in 2021, and it opened up again in 2022. Why is this even relevant?
What matters for a lender is how it happened. About a quarter of the offices sold each year had a high risk score. Buyers didn’t walk away. They just paid less.
Case Study
Let’s open the study up, because the data behind it is today’s fintech story.
Robert M. White, Jr. founded Real Capital Analytics. Later, Emilie Mazzacurati founded Four Twenty Seven, a Berkeley, California climate data firm. She named it after 427 million tonnes of carbon dioxide, California’s 1990 emissions level, which the state had set as its target for 2020. In 2019, Moody’s took a majority stake in Four Twenty Seven. Then, MSCI bought Real Capital Analytics in 2021 for $ 950 million. Finally, in 2023, the reinsurer Swiss Re bought Fathom, a flood modeler in Bristol whose data builds the flood part of those hazard scores.
Deal prices from one company, hazard scores from another, flood maps from a third. That stack made this measurement possible.
Four Twenty Seven scores six hazards: floods, heat stress, earthquakes, water stress, sea level rise, and wildfires. The scores are an annual snapshot for a postal code or city. When measuring specific hazards like river flooding, heat stress, or wildfires, the working paper group evaluated regions based on their maximum risk levels. On that measure, the paper finds rising discounts for flooding where the worst score anywhere in the region is Red Flag, and for heat stress and wildfire where it is High or Red Flag. The authors read the difference as geography. Heat stress covers a whole region, so a regional average catches it. Flooding and wildfire are local, so an average washes them out and only the worst score shows the damage. The flood result is the smallest and the least certain of the ones they report. But it is there, and it is there precisely where the worst score sits.
Their model compares office buildings sold in the same year and the same country. It accounts for whether the office is in the central business district, as well as regional income, growth, house prices, and population. The price it explains is price per square foot, so scale is already netted out. What it doesn’t account for is the building itself, its age or its condition. So in this result, comparable means a comparable location, not a comparable building.
The paper does look at building age, but in a separate test and for a different risk. On 15,184 transactions, it uses age and time since last renovation as a stand-in for energy efficiency, and finds the spread between new and old buildings widened by 18 percentage points. That’s transition risk, not storm risk. From 2018, activity shifted toward newer buildings.
In the final two years of data examined in the study, 2021 and 2022, the working paper reviewed hazards individually. They found heat stress and sea level rise both carried a significant extra discount during that timeframe. They used earthquake risk as a control. It showed no rising discount, unlike other hazards more directly related to climate risk. Water stress showed no discount at all, in any year from 2007 to 2022.
Physical risk showed up in price. Transition risk showed up in who could find a buyer.
Who were those buyers? Investment funds represented just under 60 percent, while about 20 percent were companies. About ten percent of buyers were pension funds and insurers.
Institutions are on the buy side of nearly every deal in this sample, so their pricing is what sets the comparables for everyone else.
Strategic Implications
The paper’s data stopped in 2022. This is where the market stands in 2025 and 2026.
The market is coming back, slowly. CBRE counted €59.1 billion in European real estate investment in the second quarter of 2026, up 10 percent year over year.
MSCI’s own Real Capital Analytics data shows €10.5 billion of European office deals in the first quarter, down 3 percent.
The European Central Bank’s May Financial Stability Review says commercial property prices point to a return to positive annual growth. But Eurozone deal volumes are still about 60 percent below their 2019 peak by value, and the Bank says financial stability vulnerabilities remain elevated.
As deals return, they’ll clear against whatever discount buyers now apply, except there is no current measure of that discount. But factors are driving it.
Driver one is the exit yield. In our modeled scenario, apply the 2022 discount of about 13 points to an office. If rent holds, a lower price is a higher yield. An assumed 5 percent exit yield becomes about 5.69 percent, some 69 basis points wider. On an office worth an assumed €50 million, that’s about €6.1 million of value. For context, Savills puts the average European prime office yield at 4.9 percent in the second quarter of 2026. There, the same step yields 5.58 percent, for illustration.
Driver two is liquidity. In the baseline, high-risk offices kept selling. The cost came through price, not through a longer marketing period. For a seller, that’s a pricing question, not a timing one.
Driver three is the lender. The European Banking Authority’s guidelines on managing ESG risks have applied since January 11, 2026, to every bank except small, non-complex ones. They list, among the things banks should monitor, exposures and collateral in high-flood-risk, water-stressed, or wildfire-risk areas. And in the ECB’s July lending survey, banks named physical risk to real estate as the dominant climate reason for tightening credit on housing loans. That’s housing, not commercial property, but the direction is clear.
Driver four is the policy-maker. RICS published the fourth edition of its global standard on ESG and sustainability in commercial property valuation on January 28, 2026. It took effect on April 30. It provides guidance on how to assess ESG where it’s significant to value, and it adds an EU section. It doesn’t name flood or physical risk.
Driver five is the hazard itself. The current evidence here is strong. In late June 2026, Aon reports that 17 European countries broke their all-time June temperature records, with more than 1,000 deaths across France, the UK, Spain and Belgium. Swiss Re says Europe now averages 21 to 26 days per year at 30 degrees Celsius or more, against 10 to 17 days in the 1950s. The European Environment Agency puts EU weather and climate losses at €822 billion from 1980 to 2024, and floods were 47 percent of that. So floods drive losses, even though they didn’t clearly drive office prices in this study.
Insurance cuts both ways right now. Marsh says commercial property insurance rates in Europe fell 9 percent in the second quarter of 2026. That’s a soft market. But Munich Re and JLL report that premiums for office buildings in Germany have risen 8 to 12 percent per year on average since 2018.
Future Signal
Back to the founders, and where they are now. Emilie Mazzacurati left Moody’s in 2022 and is now founding partner of Tailwind Futures. MSCI still publishes the Real Capital Analytics deal data. And in January, Fathom said Swiss Re had built its flood data into Swiss Re’s own flood catastrophe model. The insurer that owns the flood model now uses it in its own view of flood risk. The data that measured this discount now sits inside the firms that price risk.
The wider market keeps building.
In August, Climate X partnered with the consultancy IBD Sustain to take physical-risk data into real estate advisory work. Deepki bought three firms and says it now monitors more than €4 trillion of client assets. Notably, the voluntary net-zero pledges behind the 2023 new-building premium have since weakened, while the building rules for offices have not.
As Eurozone office volumes recover, expect hazard scores to move from the ESG appendix into the valuation report and the lender’s credit file. That directional forecast would be discredited if a new ECB or MSCI reading after 2022 shows the discount flat or gone. The baseline for that test is the 2022 figure.
Stakeholder Takeaway
If you are an investor or developer, pull the hazard score for every office you plan to sell, and test the exit against a discount, not a flat market yield.
If you are a lender, ask whether the appraisal reflects hazard before you size the loan.
If you are an insurer, the data behind this discount is the data your pricing competes with.
As always, KNOW YOUR SIGNALS and BE CLIMATE READY!
Jamie
Run this on your own deal
The CRDF Signal Tracker™ built for this brief lets you log the four readings this brief turns on: the high-risk office discount, the high-risk share of deals, the young-building share of deals, and the valuation and lending rules that ask for hazard data, with every entry dated and sourced. Free, no signup: Brief 40_CRDF Signal Tracker™ (xlsx)
New to the framework? The blank master CRDF Signal Tracker™ and Deal Stress Test™ workbooks are at climatereadyre.com/tools.
Related briefs
Same signal (S4 Valuation & Appraisal Gap):
Brief 37 · Climate Data: Commercial Mortgage Underwriting & Pricing
Next in sequence:
Brief 41 · France’s CatNat Surcharge: A Market Risk Signal - coming soon
Sources
Every figure above includes the data coverage date, the publication date, and the date I verified it.
The sample — 24,386 office sales matched to physical climate risk scores, across the Eurozone plus Bulgaria; mostly deals of €10 million or more; sales from 2007 to 2023.
Foerster, Ryan & Scheid, ECB Working Paper No 3059, pages 10-11 · Data as of 2007-2023 · Published May 2025 · Accessed Sep 2026
The publication month is from the ECB author profile and is not printed on the paper. Bulgaria joined the euro on January 1, 2026, after the study period.
The headline — the average discount on a high-risk building increased by 24 percentage points between 2007 and 2022.
Foerster, Ryan & Scheid, ECB Working Paper No 3059, page 5; Figure 4 page 17; page 18; conclusion page 31; Annex Table 4 page 37 · Data as of 2007-2022 · Published May 2025 · Accessed Sep 2026
A swing from a small premium in 2007, not the size of the 2022 discount. The model carries no building traits, and no current measure was found.
The path — not consistently significant before 2012, always negative and significant from 2012 onward, and largest in 2013.
Foerster, Ryan & Scheid, ECB Working Paper No 3059, pages 17-18; Annex Table 4 page 37 · Data as of 2007-2022 · Published May 2025 · Accessed Sep 2026
A path through 2022 only. No current measure was found.
The high-risk share — about a quarter of transacted offices each year have at least a High score in at least one hazard.
Foerster, Ryan & Scheid, ECB Working Paper No 3059, Figure 3 title page 14; page 13; Figure 8 page 22 · Data as of 2007-2023 · Published May 2025 · Accessed Sep 2026
Pooled across six hazards. No current measure was found.
The liquidity finding — the change in pricing appears to have occurred in an orderly manner, with no implications for liquidity in the market for high-risk buildings.
Foerster, Ryan & Scheid, ECB Working Paper No 3059, abstract (also SSRN 5265614) · Data as of 2007-2023 · Published May 2025 · Accessed Sep 2026
A study-period finding. No current high-risk-specific liquidity measure was found.
The scores — Four Twenty Seven scores six hazards, namely floods, heat stress, earthquakes, water stress, sea level rise, and wildfires; high-risk means at least one High or Red Flag.
Foerster, Ryan & Scheid, ECB Working Paper No 3059, page 11 · Data as of a single snapshot · Published May 2025 · Accessed Sep 2026
The score has no time component, so one snapshot is applied to every sale in the sample.
The worst score — rising discounts for flooding where the regional maximum is Red Flag, and for heat stress and wildfire where it is High or Red Flag.
Foerster, Ryan & Scheid, ECB Working Paper No 3059, Tables 2-3, pages 21-23 · Data as of 2021-2022 · Published May 2025 · Accessed Sep 2026
The flood result is the smallest reported, and on average, flood is not significant. The paper covers offices only.
Heat and sea level — heat stress and sea level rise carry a significant extra discount in 2021 and 2022.
Foerster, Ryan & Scheid, ECB Working Paper No 3059, Table 2, page 22 · Data as of 2021-2022 · Published May 2025 · Accessed Sep 2026
Compared with 2007 to 2020. No current measure of sea-level rise was found.
The control and the null — no rising discount for earthquake risk, and no discount at all for water stress from 2007 to 2022.
Foerster, Ryan & Scheid, ECB Working Paper No 3059, pages 2 and 21 · Data as of 2007-2022 · Published May 2025 · Accessed Sep 2026
The paper’s own text and table differ on heat under the worst-score test.
Building age — on 15,184 transactions, the spread between new and old buildings widened by 18 percentage points; activity shifted to younger buildings from 2018.
WP 3059 pages 12, 28, 30 and Annex Table 5; SUERF Policy Brief No 1223 page 3 (same evidence) · Data as of 2007-2023 · Published May 2025 · Accessed Sep 2026
Age and time since last renovation stand in for energy efficiency. Transition risk, not physical risk.
The buyers — investment funds just under 60 percent of purchases, companies about 20 percent, and pension funds and insurers about 10 percent.
Foerster, Ryan & Scheid, ECB Working Paper No 3059, page 10 · Data as of 2007-2023 · Published May 2025 · Accessed Sep 2026
The buyer mix over the whole sample, not a current reading.
The deal data — MSCI agreed to buy Real Capital Analytics for $950 million in cash; founder Robert M. White, Jr.
MSCI via Business Wire · Data as of Aug 2021 · Published Aug 2, 2021 · Accessed Sep 2026
A historical event, not a market measure. MSCI completed the purchase on September 13, 2021.
The hazard data — Moody’s acquired a majority stake in Four Twenty Seven, of Berkeley, founded and led by Emilie Mazzacurati.
Moody’s Corporation press release · Data as of Jul 2019 · Published Jul 24, 2019 · Accessed Sep 2026
The price was not disclosed. Her 2022 departure from Moody’s rests on a Responsible Investor headline.
The name — Four Twenty Seven is named for California’s 1990 emissions inventory of 427 million metric tons of carbon dioxide.
Columbia Climate School, State of the Planet (Peter Francis Deneen) · Data as of 1990 · Published Aug 5, 2019 · Accessed Sep 2026
A university publication. Not load-bearing.
The target — California’s target was to bring annual emissions down to 427 million tonnes by 2020.
The Economist, ‘Firms that analyse climate risks are the latest hot property’ · Data as of 2019 · Published Nov 23, 2019 · Accessed Sep 2026
Paywalled; read only the opening paragraph. It agrees with the 1990 figure because the 2020 target was set at the 1990 level.
The flood data — the study’s flood inputs build on Fathom, which Swiss Re acquired.
Swiss Re press release; Foerster, Ryan & Scheid, ECB Working Paper No 3059 page 10 · Data as of Dec 2023 · Published Dec 14, 2023 · Accessed Sep 2026
A historical event. The price was not disclosed.
European volume — €59.1 billion of European real estate investment in the second quarter of 2026, up 10 percent year over year.
CBRE, European Real Estate Investment Figures Q2 2026 · Data as of Q2 2026 · Published Jul 31, 2026 · Accessed Sep 2026
Europe, not the Eurozone alone, and all sectors, with no office figure.
European office volume — €10.5 billion of European office deals in the first quarter of 2026, down 3 percent year over year.
MSCI, ‘Real Assets In Focus: Europe Q1 2026’ (Will Robson, Tom Leahy), citing RCA · Data as of Q1 2026 · Published May 2026 · Accessed Sep 2026
An undated event deck. Figures were read from a table by text extraction.
The ECB’s view — commercial property prices point to a return to positive annual growth; Eurozone transaction volumes still about 60 percent below their 2019 peak.
ECB Financial Stability Review, May 2026, section 1.5 · Data as of Q4 2025 · Published May 2026 · Accessed Sep 2026
The 60 percent is by value. The Review carries no climate findings on commercial property.
Prime office yields — the average European prime office yield was broadly stable at 4.9 percent in the second quarter of 2026.
Savills, ‘Spotlight: European Office Investment - Q2 2026’ · Data as of Q2 2026 · Published Jul 27, 2026 · Accessed Sep 2026
Prime offices across Europe, not the Eurozone alone. It is the input to the 5.58 percent illustration.
The bank guidelines — applicable from January 11, 2026, to institutions other than small and non-complex ones, which follow by January 11, 2027; collateral in high flood risk areas is among the items to monitor.
European Banking Authority, press release and Final Guidelines · Data as of Jan 2026 · Published Jan 9, 2025 · Accessed Sep 2026
Adopted guidelines, checked as applicable in September 2026.
The lending survey — physical risk to real estate was, in net terms, the dominant climate-related tightening factor for credit standards on housing loans.
ECB, euro area bank lending survey, Q2 2026 · Data as of Q2 2026 · Published Jul 21, 2026 · Accessed Sep 2026
Housing loans, not commercial property. The survey publishes no commercial property climate question.
The valuation standard — the fourth edition of the RICS global standard on ESG and sustainability in commercial property valuation, effective April 30, 2026.
RICS news release · Data as of Apr 2026 · Published Jan 28, 2026 · Accessed Sep 2026
A professional standard. It adds an EU section and does not name flood.
The June heat — 17 European countries broke all-time June temperature records in late June 2026, with more than 1,000 deaths across France, the United Kingdom, Spain, and Belgium.
Aon, H1 2026 global catastrophe report · Data as of H1 2026 · Published Jul 22, 2026 · Accessed Sep 2026
Hazard evidence only. It says nothing about office prices.
Hot days — Europe averages 21 to 26 days per year at 30 degrees Celsius or more, against 10 to 17 days in the 1950s.
Swiss Re Institute, First-half 2026 insured catastrophe losses · Data as of 2016-2025 · Published Aug 11, 2026 · Accessed Sep 2026
First-half figures end June 30, 2026.
Losses — EU economic losses from weather and climate extremes of €822 billion from 1980 to 2024, with floods at 47 percent.
European Environment Agency, indicator ‘Economic losses from weather- and climate-related extremes in Europe’ · Data as of 1980-2024 · Published Oct 14, 2025 · Accessed Sep 2026
Losses across all assets, not office prices.
Insurance rates — commercial property insurance rates in Europe fell 9 percent in the second quarter of 2026.
Marsh, Global Insurance Market Index Q2 2026 · Data as of Q2 2026 · Published Jul 23, 2026 · Accessed Sep 2026
A broker’s index across all perils and all commercial property.
German office premiums — premiums for office buildings in Germany have risen 8 to 12 percent per year on average since 2018.
Munich Re Risk Management Partners with JLL, citing Germany’s Federal Association of Property Managers · Data as of 2018-2025 · Published Feb 18, 2026 · Accessed Sep 2026
Germany only, and not stated as climate-driven. The underlying association data was not opened.
The founder now — Emilie Mazzacurati is the founding partner of Tailwind Futures.
Tailwind Futures, team page · Data as of Apr 2026 · Published Undated, last modified Apr 13, 2026 · Accessed Sep 2026
Her firm’s own team page.
The flood model — Swiss Re integrated Fathom flood hazard and terrain data into its internal catastrophe model.
Fathom newsroom · Data as of Jan 2026 · Published Jan 13, 2026 · Accessed Sep 2026
Swiss Re owns the issuer. Global, not specific to Europe.
Climate X — a partnership with IBD Sustain to bring asset-level physical climate risk data into real estate advisory work.
Climate X press release (LONDON; 5th August 2026) · Data as of Aug 2026 · Published Aug 5, 2026 · Accessed Sep 2026
An issuer release. No link to the ECB study.
Deepki — acquired EVORA Global, Metry, and Camion Energy, and now monitors more than €4 trillion of client assets.
Deepki (Dan Pope), ‘Building the Future of Real Estate Intelligence: A Conversation with CEO Vincent Bryant’; ESG Today 2026-08-14 · Data as of Aug 2026 · Published Aug 7, 2026 · Accessed Sep 2026
The €4 trillion is clients’ assets under management, not Deepki’s own. Energy data, not physical risk.
The banking alliance — Net-Zero Banking Alliance members voted to become a framework, and the alliance ceased operations.
ESG Today (Mark Segal), quoting an NZBA spokesperson · Data as of Oct 2025 · Published Oct 3, 2025 · Accessed Sep 2026
Trade press relaying the alliance’s statement. Attributed context only.
The building rules — infringement procedures against all 27 member states over the recast Energy Performance of Buildings Directive; the goal remains a zero-emission building stock by 2050.
European Commission, DG Energy news · Data as of Jul 2026 · Published Jul 15, 2026 · Accessed Sep 2026
An adopted directive, late in transposition everywhere. Minimum energy performance standards for non-residential buildings stand.
The 2022 position and the exit yield illustration — a 2022 discount of about 13 points, roughly 12 percent below comparable offices, after a small premium in 2007 and a position back close to zero in 2021; an assumed 5 percent exit yield becomes about 5.69 percent, some 69 basis points wider; about €6.1 million of value on an assumed €50 million office; at a 4.9 percent prime yield, 5.58 percent.
CRREI modeled scenario · Method: CRREI arithmetic on ECB Working Paper 3059, Annex Table 4, and Savills. The 2022 position adds the high-risk main effect to the 2022 interaction, a net of about 13 points, or about 12.2 percent on price. With rent held constant, the new yield is the old yield divided by 0.8781, and the value lost is the office value times 0.1219. The 5 percent yield and the €50 million value are CRREI assumptions. · Modeled — not a specific asset
An illustration, not a deal. The net position is a sum of two coefficients with no published standard error, and it rests on 2022 coefficients because no current measure of the discount exists.
Commentary and analysis only. Not investment, financial, legal, tax, or professional advice. CRDF tools are illustrative; examples are composites drawn from public data. Do your own due diligence and consult qualified professionals.
I run this analysis on specific deals. If you are testing an office exit against a climate discount, book 20 minutes.
Jamie Wolf, MBA — Founder & Publisher, Climate-Ready Real Estate Investing, © 2026, CR REI Holdings LLC